Daily Global Economic Calendar

Real Time Economic Calendar provided by Investing.com.

Saturday, January 18, 2014

Top-Less 2013

As John Hussman brilliantly put it (here):
...2013 was a bad risk that happened to work out well, not unlike the gains earned near the end of a Ponzi scheme.
SPX 2013
 
No, it was not an easy trend to ride. As I noted before, the only way to be long in 2013 was to disregard stop loss (be it a break of previous low, 50 day MA, sentiment, Elliott Wave, internal divergences etc), non withstanding real deteriorating economic conditions (based on my observations), and stupidity and ignorance of our elected leaders and their cronies.

My biggest losses of 2013 came from trying to short the market indexes. So much so, that summer short/hedge wiped out all early-year gains. Back end, and especially October - December period, put me back in black. Important to note that I was shorting the indexes, while being long individual stocks and sectors (via ETF's). I also traded a lot of commodities, both long and short, with mixed results. Grain longs cost me some, softs where about break even, silver short was a big winner early in a year, oil worked very well both ways.

This infatuation with S&P 500 index is rather a drawback to my approach. I continue to come up with different ways to better trade SPX via Systems 10 (discontinued), System 11, and major adjustment to System 1 (too late to implement in this cycle). This research takes a lot of time, detrimental to my P&L, and pulls resources (and gains) from System 9. As I Spring to Action, I will be looking for more balance, will be able to expand Theme Investing - all with goal to reduce dependance on intermediate term forecasting of index trends.


As we enter year 2014 warning signals abound. Here are some
--------------------------------------------------------
12/20/2013
SKEW sell signal
Only 4th time in history of SKEW since 1990, it gives 'Above 140' sell signal.
Previous times:
  • 06/21/1990 - S&L Crisis (Stocks dropped 18% in next 3 months and the US entered recession)
  • 10/16/1998 - Russian Default and LTCM (Stocks soared 22% in the next 3 months and the dot-com bubble was born)
  • 03/16/2006 - Housing Bubble peak (Stock dropped 6% in next 3 months and the 'great recession' started within a year)
http://www.zerohedge.com/news/2013-12-21/last-3-times-happened-markets-turmoiled

----------------------------------------------------------------
II most bullish sentiment on record (since 1990's). Implication being - if everybody bullish, who is left to buy? BTFATH...
This, Sornette log bubble and 1929 analog here:
http://www.zerohedge.com/news/2014-01-13/just-three-charts

-----------------------------------------------
I take this guy very seriously, as his investment time frame is equal-to-little-longer then mine, and he is usually right on a money. His message - be careful
http://fat-pitch.blogspot.com/2014/01/weekly-market-summary.html#more
----------------------------------------------

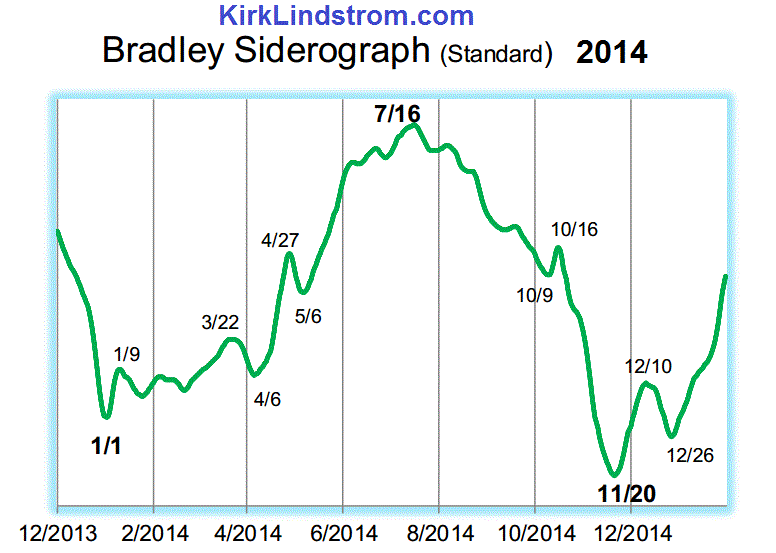
Various cycle works project turbulence ahead in 2014


-----------------------------------------------------------------------
Then, there is  John Hampson of  http://solarcycles.net/, who does very detailed analysis of sun/moon cycles and their effect on markets and mass physiology. Although it is still considered unorthodox approach by many, I am all over it. Having observed Sun, geomagnetic activity and Moon phases in real time and their effect on my co-workers, friends and family, and market, I think its safe to extrapolate results onto Northern Hemisphere population as a whole.

I've been watching this unfold for about a year, wrote about high Solar activity here in May 2013.
As for Moon Phases - its no joke:
http://ibergamot.blogspot.com/2012/08/read-moon-phases-im-not-crazy.html

Specifically, we are going right thru Solar Cycle Maximum, as Sun's poles flipped couple of weeks ago.
The following quote is from here
Historically, solar maxima have correlated with earthquakes and peaks in temperature oscillation. They have also correlated with protest/war/revolution, inflation oscillation peaks and speculative parabolic peaks (often secular bull peaks). With both magnetic poles now having flipped for SC24 maximum...the solar max then gives way to economic recession...
Important to note, that although three prior Solar Cycle peaks where followed by economic recession, they didn't start right away, and where not necessary accompanied by catastrophic bear market everywhere, but correlation is undeniable. Causation? I got your hard data right here, mothafucka:


---------------------------------------------------------------------------
David Collum - 2013 Year in Review

He comes in at 5min and again at 15min. He said everything I do, or is it the other way around? Also, all this has been wrong for at-least a year, and would not help to make money. Quite the opposite. Still...
 http://www.peakprosperity.com/blog/84101/2013-year-in-review

---------------------------------------------------------------
Of course, Aden sisters and Louise Yamada are bullish as shit. Have they ever been right about anything? Shills...
http://www.marketwatch.com/story/there-are-all-sorts-of-reasons-to-remain-bullish-2013-12-31?link=MW_TD_latest
----------------------------------------------------------------

One my favorite 'Characters', Marc Faber :
"We are in a gigantic financial asset bubble,"  "everybody's bullish", "...this could burst any day. I think we are very stretched." bitcoin and more. He's been saying all this for a while, it doesn't make him wrong, just early


--------------------------------------------------------------


Monday, January 6, 2014

Character

According to Google, 'Character' is a "the mental and moral qualities distinctive to an individual."

As one of my favorites, Mr Wolfe in Pulp Fiction pointed out:
Just because you are a character doesn't mean that you have character.
Two of my biggest gains of 2013 came from investing in companies led by very strong personalities, extraordinary people, real 'Characters'.   A series of profitable trades in strong uptrend of Navios Marine (NM) made me think of Angeliki Frangou each and every time. Its not an accident that while doing initial analysis of shipping industry in March 2013 (in Discovery at Sea post), I picked her interview out of all speakers of latest TradeWinds conference.  Mindboggling 400% profit in TSLA was delivered courtesy of Mr. Elon Musk of Tesla (TSLA) and SolarCity (SCTY). I actually started investing in SCTY in this post (link),  based solely on "young faces of their management team". Company just came public, so I had no indicators, no support/resistance, no earnings, no price history. I wrote:
...it gives me real pleasure to see young faces of their management team. I am a pretty good  face reader, and I am smiling looking at these boys and girls... ...management of SCTY are young, ambitious, driven young people. In finance it's bad, in service/manufacturing it is a combination that been changing the world thru-out history. Look up Elon Musk and see what he did, and what he set out to do.
Having said that, my stop is below most recent low, until further instructions...

“Character is like a tree and reputation its shadow. The shadow is what we think it is and the tree is the real thing.”
― Abraham Lincoln

"Character cannot be developed in ease and quiet. Only through experience of trial and suffering can the soul be strengthened, vision cleared, ambition inspired, and success achieved."
- HELEN KELLER (1880-1968) American blind and deaf writer/lecturer

 “Fame is a vapor, popularity is an accident, riches take wings, those who cheer today may curse tomorrow and only one thing endures - character.”
― Harry S. Truman

 “Love should be treated like a business deal, but every business deal has its own terms and its own currency. And in love, the currency is virtue. You love people not for what you do for them or what they do for you. You love them for the values, the virtues, which they have achieved in their own character.”
― Ayn Rand

-----------------------------------------

I find it bit alarming that usage of the word 'Character' has been dwindling over past 150 years

-----------------------------------------

Wally Weitz, whose flagship Weitz Partners Value Fund is celebrating its thirty year anniversary, and Tom Russo, with his market-beating Semper Vic Partners Fund

------------------------------------------------------------
This is how Marc Faber lives
------------------------------------------------------------


Friday, December 27, 2013

New T and Internals Update

First of all, there is this 3 year wide Nasdaq A/D T , that I've been watching for months and first wrote about here (link). Projected peak for NaADT11/2012  is late July - early August 2014.
Right next to it is new Volume Oscillator T12/2013. I think that shorter blue VOT12/2013 is a correct one, but reliability of this analysis is questionable, T-Theory had alot of misses lately as i noticed back in September in this post (link).


 ----------------------------------------------------
 A completely different look at Volume Oscillator weekly plot. Everything is different here

W VO T 2013
I see a possibility, that 'misses' of T-Theory in 2013 are entirely my own doing. Trying to fit T's into every zig and zag of market. Looking for action. Degenerate Gambler!  Volume trends are not a short term phenomenon, they take time, they can change, they are not constant. So I stepped back to try and see a damn forest.

In this post (link) back in May 2013 I plotted VOT 8/2011 with 1 year cash build up (series of lower highs and lower lows on Volume Oscillator), with multiple touches of down-sloping trendline and bull trap. Very similar to this VOT 6/2013.

VO T 6/2013
The center-post location is very different. Back in 2011 it was a very sharp 20% drop that felt like real bear-market. Summer of this year was nothing alike. I came into June'13 with sizable short position still under water and decided that "...market is not going down, so I have no business to hold shorts..." and became Non - Delta Neutral in this post (link). Then market went even lower. On OpEx day (link) I noted that :"All my A/D indicators are at "last stand" line. In recent past it led to hard V-type reversal." It did, although on June 25 (one day past the bottom) I was making parallels to 1987, noting "...how fast a pullback of a strong bull market turns into failure..." in this post (link). It was a period of high solar activity and geomagnetic storms, economic news where good, all other news where bad, Obama fired Bermonkey on live TV, and $VIX went to 21. That was the bottom.

Top? This is what I wrote 2 days before top on May 20: "Mostly all of internal divergences are gone, and aside from everything being overbought and obnoxiously bullish - there are absolutely no indication of immediate market top." I also laid out my case for being a Perma Bear in the same post (link). All the while I was holding hedge of at-least 3X position  size short via SDS, QID, HDGE, which end up costing me most of spring profits from longs. On May 22 I was 70% invested (post (link)

This year changed the way I think and trade in more ways than one. No one can successfully manage Kapital, while having this type of mush on a brain. Sucker...

-----------------------------------------

Weekly Nasdaq A/D Cumulative (mentioned above)
http://stockcharts.com/h-sc/ui?s=$NAAD&p=W&yr=3&mn=0&dy=0&id=p03531550066
My A/D indicator (NYSE) with BPSPX and SPXA50R
http://stockcharts.com/h-sc/ui?s=$NYAD&p=D&yr=1&mn=0&dy=0&id=p39294453226
McClellan Suite: NYMO; NYSI; NAMO
http://stockcharts.com/h-sc/ui?s=$NYMO&p=D&yr=1&mn=0&dy=0&id=p04197492070
T-Theory Volume Oscillator
http://stockcharts.com/h-sc/ui?s=$NYUD&p=D&yr=1&mn=0&dy=0&id=p81565637438
Risk-on /Risk-off ratios, aka Confidence indicator (FAGIX:VUSTX;  HYG:LQD;  $SPX:$USB)
http://stockcharts.com/h-sc/ui?s=FAGIX:VUSTX&p=D&yr=1&mn=0&dy=0&id=p43022938657
Golden Indicator with World Ratios
http://stockcharts.com/h-sc/ui?s=$SPX:$GOLD&p=D&yr=1&mn=0&dy=0&id=p51708175586

http://ibergamot.blogspot.com/2013/09/internal-indicators.html
http://ibergamot.blogspot.com/2013/04/internals-study.html
---------------------------------------------


Wednesday, December 25, 2013

ZHONGGUO


Zhongguo is the most common (mandarin) name for China, it means "Middle Country" or something similar. Here are some quotes from internets:
Ancient Chinese believe that China is the center of the world, its in the middle of earth... Some Western writers use the translation "middle kingdom" or "central kingdom" to imply that China has a deeply rooted self-centered psychology as the center of the universe...  The ancient Chinese believed that they are the only civilization on earth while being surrounded by barbarians... 
5000 years of national history is quite a claim, for sure. Plus there is this:
 Those assholes keep dissing Chinese, but they are the ones rocking made in China versace and driving in China manufactured Cadillac
ZHONGGUO investing is a challenge in itself, and has been a dud for a past few years. Complains? Fuck you.  Shanghai Composite Index ($SSEC) gained 6000% from 1990 to 2007, that is 60X your initial investment in less than 20 years, with plenty ups and downs to trade. Its resting now, but its not the first time its down 50% +. In a relatively short index history there where 2 such periods, lasting 4-6 years, followed by multi-year rip higher. Its not a question whether you will double your money, but how many times...
Below is a historical chart up to Dec'12. Notice - chart is log-scale !
Nothing much changed since then.
 I've been keeping an eye on a situation for years, even mentioned it here in April'12 (link).
There are some regulatory changes that will be at work for a next year or two. Specifically, there really isn't a straight way to invest in SSEC - its a composite index comprises of all the A shares (traded in local currency) and B shares (in foreign currency) listed on the Shanghai Stock Exchange. Up until recently foreign investors where not allowed to go into 'inland' market. So we buy A-Shares listed in Hong-Kong (H-Shares), or go for N-Shares (Chinese companies listed in US market, but may or may not be incorporated in China), or other various layers of this particular scam.

All this may be changing soon, as foreign access to A listings controlled under the Qualified  Foreign institutional investor (QFII) scheme, has been relaxed somewhat in 2012 and again in March 2013. It is expected that A-shares with increase in allocation by as much as 60% over next couple of years. In that process China will likely become 4th or 5th largest equity market in the World. Presently Zhongguo is on #9 spot. Liquidity? I got your liquidity right here...
Big Boys are all over it. More here:
http://www.ftse.com/Research_and_Publications/2013Downloads/FTSE_China_A-shares_and_Global_Indices_Final_Version.pdf

Bunch of new ETF's popping up all over the place, all ready with enormous expense ratios, vague allocation rules, and not enough money to go around. I am still most interested in FXI (large cap A-shares in Hong Kong), and PGJ (US listed), with  possibly HAO (small caps)

http://stockcharts.com/freecharts/candleglance.html?$SSEC,FXI,GXC,MCHI,CHIQ,HAO,PGJ,fxp|B

PGJ - PowerShares Golden Dragon China Portfolio invests in N-Shares, Chinese companies listed in US.
http://www.invescopowershares.com/products/overview.aspx?ticker=PGJ#hold
Expense ratio 0.75%. Severely overweight in Information Technology (55%). Abnormally largest holding (8.5%) is CTRP - Ctrip.com - some kind of travel and lodging service I never heard of.

Finviz screen: China, over 300mil market cap, over $5, over 100K average volume. 49 results.
Most of top ones are in PGJ, but at different weightings.
http://stockcharts.com/freecharts/candleglance.html?PTR,SNP,LFC,BIDU,NTES,QIHU,CTRP,SFUN,SINA,YOKU,EDU,VIPS|B
http://stockcharts.com/freecharts/candleglance.html?ACH,YZC,MR,QUNR,YY,SOHU,GA,WX,NOAH,HMIN,EJ,HTHT|B

FXI - iShares FTSE China Large-Cap ETF, based on FTSE China 25 index, consisted mainly of  H-Shares - blue chip stocks of largest 25 Chinese companies (H Shares, Red Chips and P Chips) listed on the Stock Exchange of Hong Kong. This seems to be the best access to A-Shares, as we have only few US traded, Hong Kong listed, Chinese main land companies to invest. (CHL, CEO, CHU, MPEL?)
...Easy as ChinaKing menu...
September 2014 they will change it to FTSE China 50 index, doubling allocation to A-Shares.
http://www.ftse.com/Indices/FTSE_China_Index_Series/index.jsp  FXI has 0.75% exp ratio, 2% divi. Abnormally large allocation is  Financials 56%.http://us.ishares.com/product_info/fund/overview/FXI.htm
--------------------------------------------------------------------------------
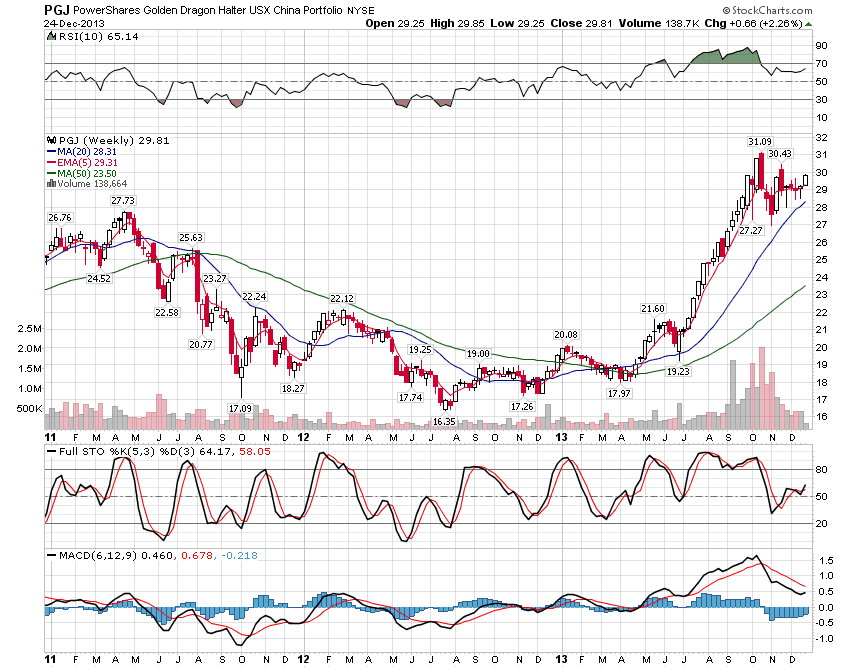
UPDATE 11/26/2014
$SSEC started to rally at the end of summer 2014, and by November took out  2400-2500 resistance that started way back in winter of 2011. FXI is lagging somewhat, still fighting 40-42 level, but development is positive no doubt.
Investment landscape is poisoned by alot of scams and hype surrounding all kinds of internet, software and game stocks, plus BABA (ipo'd in September '14) pulled a lot of funds from everything China. Technically, stocks split into two distinct groups (for reasons unknown to me) -  some gap and jump all over the place, others trade tight with good daily patterns. I focus on latter kind. Specifically I want to avoid anything with wide following, many news and busy Yahoo message board.

http://stockcharts.com/freecharts/candleglance.html?HTHT,HMIN,MR,WX,CBPO,EDU,XRS,DL,NORD,JOBS,ZPIN,HOLI|B|P5,3,3|0

Of note:
all make money, except NORD
all don't have a lot of debt, except XRS and NORD
all don't have a lot of shorts, except ZPIN and MR (MR 16% float short; 23SR !)
all don't have high P/E, except JOBS (P/E 60!)
This list is not perfect by any stretch of imagination, but offers some alternatives off the beaten path, and should compliment FXI very nicely in 2015 and hopefully beyond.
http://www.finviz.com/screener.ashx?v=150&t=HTHT,HMIN,MR,WX,CBPO,EDU,XRS,DL,NORD,JOBS,ZPIN,HOLI&o=-marketcap


Monday, December 23, 2013

Dow Leaders, 2013 Free Lunch and Fat Fingers


FAT FINGERS are popping up on a bunch of issues I watch and trade. I call them 'Big Stick Red Top', because they are usually a mark of topping issue. At-least I don't want to mess long with markets that behave so erratically after substantial advance.
XHB, VNM, BG, small one on SEA (since overcame), now this 30-year bond, and possibly TSCO.
This is not a coincidence.
http://www.zerohedge.com/news/2013-12-23/fat-finger-sends-long-bond-futures-soaring-overnight-trade
-----------------------------------------------
FREE LUNCH of 2013
This strategy is from StockTradersAlmanac. I watched it last year. It worked
Full monty is here:
http://blog.stocktradersalmanac.com/post/Free-Lunch-Is-Ready-Triple-Witching-Serves-Up-18-Bargain-Stocks-NYA-XAX-IXIC-GLD-HLF
“Free Lunch”  is purely a short-term strategy... Traders and investors tend to get rid of their losers near yearend for tax loss purposes, often driving these stocks down to bargain levels. Research has shown that NYSE stocks trading at a new 52-week low on or about December 15 will usually outperform the market by February 15 in the following year.
I used similar  filters in Finviz:
50mln+ market cap;  50K+ average volume;  over $1 price
(they using 20mil market cap and 10K volume... c'mon, its a little bit out there, IMNSHO)
0-3% above 50day low;  50%+ below 52week high
The closer to 52week low, the better
Results as of  12/23/2013 BMO, shows alot of gold miners (no surprise here)
http://stockcharts.com/freecharts/candleglance.html?NEM,AUY,KGC,AU,EGO,BVN,IOC,IAG,HMY,CDE,AUQ,MUX|B|P5,3,3
http://stockcharts.com/freecharts/candleglance.html?SVM,AT,EXK,KONG,MVG,PSMI,TRX,AMCN|B|P5,3,3
These results are so horrible looking. How can I even touch this garbage?..oh

UPDATE 12/24/2013
On a second thought here are my picks. High short interest may be squeezed, low inst ownership may be increased, etc ... all weak reasons. I rather buy strong stocks on a rise, but willing give it a shot with half-position size an about half of these:
http://stockcharts.com/freecharts/candleglance.html?IOC,TRX,MUX,PSMI,KGC,AU,BVN,IAG,CDE,KONG,AMCN,HMY|B|B10
Conservatively I should take 10% profit as soon as I have it, and not wait for mid February exit time-window. Entry low is the stop. No exceptions. Lets see...

UPDATE 1/16/2014
 Now their list is revealed, and surprisingly it doesn't match mine very much. WTF?
http://blog.stocktradersalmanac.com/post/Free-Lunch-Stocks-The-Gift-That-Keeps-on-Giving-NYA-COMPQ-SEED
18 stocks they selected show an average profit of 15%, with couple of small losers and  several big winners.
I traded:
Now all out with small profit to show for my efforts, but I felt very uncomfortable, as this strategy goes against my philosophy of buying high and selling higher (also sell low and cover lower).
----------------------------------------------

The idea for DOW LEADERS  came from here:
http://blog.stocktradersalmanac.com/post/2014-Stock-Market-Technical-Analysis-Forecast--Looking-Back-to-See-Forward-
by Bruce M. Kamich, CMT (never heard of him)
This is another approach, very much in spirit of System 12. I see it can be used not only as warning signal, but also as strategic allocation tool. Here is the gist:
From time to time we like to dissect the Dow Industrials. We look at each component and classify it as being in a clear uptrend or a sideways/neutral trend or a downtrend. Starting at 3M and going stock by stock to Wal-Mart Stores we found that we could only count 10 Dow stocks in clear uptrends even as the Dow made a new all-time high Wednesday. The 20 other stocks have been a drag on the famous average. This same exercise back in October 2007 found only 8 stocks making new highs while the remaining 22 were in bad shape (just think about the names that were subsequently removed)....We suggest keeping a closer watch on those ten uptrends – MMM, AXP, BA, DIS, DD, XOM, GE, GS, NKE, and V – and if they weaken without rotation into the other names then a more defensive posture should be assumed.
http://stockcharts.com/freecharts/candleglance.html?MMM,AXP,BA,DIS,DD,XOM,GE,GS,NKE,V|C

--------------------------------------------

Staying 50-70% invested. All long, bonds short (via TBT), with shorter and shorter holding periods. The bias is to reduce, protect gains, cut losses absolutely ASAP (if stock doesn't go in a market like this - it doesn't go at all).
I've been working inside this list, essentially for months, with only few changes.

http://stockcharts.com/freecharts/candleglance.html?$CEX,TBT,SDS,SRS,SKF,DVA,NM,KEX,TSCO,HRL,BG,CCJ|B|P5,3,3
http://stockcharts.com/freecharts/candleglance.html?SLV,GDX,SIL,FNV,RGLD,TRX,PPP,AG,SLW,FCX,AMLP,SCO|B|P5,3,3
http://stockcharts.com/freecharts/candleglance.html?IMAX,VNM,EEM,YELP,CVV,SEA,CG,XLF,QQQ,IWM,SBLK,DDD|B|P5,3,3
My Free Lunch: (started buying on 12/24/2013):
http://stockcharts.com/freecharts/candleglance.html?IOC,TRX,MUX,PSMI,KGC,AU,BVN,IAG,CDE,KONG,AMCN,HMY|B|P5,3,3

New watch:
 http://stockcharts.com/freecharts/candleglance.html?SPPP,PALL,PPLT,FXI,PGJ,HAO,RSX,TAN,SCTY,FAN,REMX,COPX|B|P5,3,3

Saturday, December 14, 2013

Copper Season

I've been watching Copper prices since summer, noticing how stubbornly strong it was. Although not a Precious Metal, it sits between Platinum and Palladium on Finviz Futures page. Right next to Gold and Silver. A lonely speck of green in the ocean of red. Strong? Lets say: Not as weak...with strong support near $3.
I think my position is well known:
This economy has been shit since 2011, and got worse since 2012.
I wrote about it here just recently (link) and also back in May (link) , all against the backdrop of Roaring Bull Market (link).  (How is it possible? Dow Paradox, bro...you feel me?)           
Seems to me that Dr Copper, PhD in Economics, kinda agrees with bitter yellow fruit here about the state of real economy.

There are only 4 copper miners in Finviz. FCX is the biggest, with highest dividend and smallest short ratio, but also with most debt.

http://stockcharts.com/freecharts/candleglance.html?$COPPER,JJC,COPX,CU,FCX,SCCO,RIO,AZC,LIWA,TGB,NAK,LUNMF|B|P5,3,3

Following System 12 rules, only $copper, JJC, FCX, RIO, LIWA qualifies for position. COPX is 10% under 200sma! Volume Profile is horrid on all. Nobody buys copper miners.

---------------------------------------------------------------------------
Here is Jeff Hirsch of Stock Trader Almanac on strong seasonality of Copper from mid-December to end of February.
http://blog.stocktradersalmanac.com/post/Coppers-Historically-Strong-Season-Begins-Soon-HGF-SCCO
Since 2001 there was only 2 loosing years 2006 and 2012.
I notice, that although 2012 officially failed, there was a material rally from beginning of November 2012 to beginning of February 2013. Important not to overstay my welcome.

They pick SCCO, because of correlation to metal. I don't see that correlation to $COPPER or JJC at this moment at all. In fact, judging by Price Relative study nothing correlates very much here. Non of miners look like metal. Miners themselves are all different.
http://stockcharts.com/freecharts/candleglance.html?$COPPER,JJC,COPX,CU,FCX,SCCO,RIO,AZC,LIWA,TGB,NAK,LUNMF|C|J[jjc]
---------------------------------------------------------------------------

There is an etf from GlobalX http://www.globalxfunds.com/COPX with 0.65% exp ratio, and 5% divi.
COPX has less then 30 holdings, with FCX, SCCO and Glencore at about 5% each. Top 2 holdings are Canadian companies III.TO and CS.TO.

Another etf is FirstTrust CU, with even higher exp ratio, less holdings, 3% divi and RIO as biggest position.
http://www.ftportfolios.com/Retail/Etf/EtfSummary.aspx?Ticker=CU

 COPX Fund Holdings Data as of 12/13/2013
 % of Net Assets   Name 
6.23 IMPERIAL METALS CORP
5.29 CAPSTONE MINING CORP
5.21 FREEPORT COPPR
5.20 GRUPO MEXICO SAB DE CV-B
5.01 JIANGXI COPPER COMPANY
5.01 KGHM POLSKA MIEDZ
4.87 HUDBAY MINERALS
4.85 GLENCORE INTERNATIONAL
4.71 SOUTHERN COPPER CORP
4.69 LUNDIN MINING CORP.
4.67 FIRST QUANTUM MINERALS LT
4.56 ANTOFAGASTA PLC
4.53 SANDFIRE RESOURCES NL
4.46 TECK COMINCO LTD-CL B
4.20 TURQUOISE HILL RES
4.00 VEDANTA RESOURCES
3.93 KAZAKHMYS
3.91 TASEKO MINES LTD
3.87 OZ MINERALS LTD
3.77 PANAUST LIMITED
2.13 CUDECO LIMITED
1.42 COPPER MOUNTAIN MINING
1.10 TURQUOISE HILL RIGHTS
1.08 PARK ELEKTRIK
0.88 NORTHERN DYNASTY MINERALS


Friday, December 13, 2013

Theme Compound of 2013-2014

. NOTE: as of 7/1/2015 this compound will not be updated any more.....
.             head over to new Theme Compound of 2015 (link)              ....
................................................................................................................

I will attempt to organize various themes that are of interest to me in this Theme Compound of 2013.

The notion of  Theme Investing has been paying off for years. So much so, I decided to make it my main approach to investing. "Cut your losses short and let your winners run" is a great principle of most winning traders. It doesn't have to be applied only to positions... I can use it for strategy selection.

I wrote about System 9 and Theme Investing in this post (link). Its a start...


Tuesday, December 10, 2013

TECHNIQUES OF TAPE READING- by VADYM GRAIFER & CHRISTOPHER SCHUMACHER


TECHNIQUES OF TAPE READING- by VADYM GRAIFER & CHRISTOPHER SCHUMACHER
PART ONE
A Trader’s Journey


TRADING MANTRAS
As I continued trading, I managed to make those periods of blackouts shorter and shorter. I accepted that they would happen, without frustration or panic. When they occurred, I cut back on my activity and tried
to minimize my losses while waiting for my clear state of mind to return. Step by step I developed some new ideas for returning to the correct mindset more quickly. I wrote several mantras that I would read and repeat, in a sense meditating on the subject. After a while I wrote mantras for specific trading problems. Regular repetition of them helped me reduce the number of those undesirable periods and make the ones I did experience much shorter. I regained control over myself once again. The mantras follow.

Thursday, December 5, 2013

The Big Dogs and HorseShit

Things don't fit together any more. Never mind the usual wall-of-worry, markets have gone haywire and its getting worse.

Stocks are at all time highs, volume and participation are very low, there is no public interest (nobody wants to talk to me about stocks).
Gold, Silver and miners are on a death spiral down. That great rally I picked from July to September is all gone. Since then (and especially in November) every bullish signal, every attempt to rally was blown. Its like stocks, only in reverse.  I talked some people into buying coins...they don't talk to me anymore
Gov Bonds are in bear market, that nobody trades, nobody recognizes. I've been telling people to get out of bonds for a couple of years now. Nobody did. Meanwhile rates doubled!
Commodities are in a toilet. All of them (except may-be Cocoa and Rice).

Without a doubt, all this represents an opportunity of lifetime. Literally. Especially commodities.Corn and Copper are not going to zero, not going to bankruptcy, and not going to reverse split either. Oil stands kinda separately , I think people use it as a 'store of money', a last inflation hedge that's working. It's a mistake - a foolish mis-allocation that lasted long enough to become 'a norm'. Oil worth less than 100 (may be alot less), just as surely as Coffee worth more than 100 (may be alot more). Commodity stocks is a different story (I'm working on it).

Housing recovery my ass! We got 47 million people on food stamps (largest ever, growing every year).
 What middle class? Is it a housing recovery? You know, the house - an american dream...
Here is their own fucking data:
http://www.census.gov/econ/currentdata/dbsearch?program=HV&startYear=1970&endYear=2013&categories=RATE&dataType=HOR&geoLevel=US&notAdjusted=1&submit=GET+DATA

This is kind of data I like. Un-massaged. No ratios to GDP, or unemployment, or inflation, or any kind of statistical ratios. GDP is the worst. First of all they restated it going back years (happened couple of years ago). Then it depends, how you calculate GDP. Here is ShadowStats alternative plot. Big difference, its been negative for years. Incidentally, this view corresponds very well to my own business in America since 1991. That drop during 2000-2002 recession, and then recovery somewhat into 2004-2006, exactly as I experienced myself.
http://www.shadowstats.com/alternate_data/gross-domestic-product-charts
My business blow-up at the lows, there was almost no recovery - that industry is still just a remnant of its former self.
-----------------------------------------------------------------------

Price of retail ground beef 1980-2013. Presented below with no comments. Really
http://www.theburningplatform.com/2013/12/17/keeping-it-real/
----------------------------------------------------------------

Percentage of working Americans 2000-2013, as civilian employment to population ratio. Again, based on their own fucking data.
Any questions?
(stolen from ZeroHedge)
-----------------------------------------------------------------------------

 http://tomohalloran.com/2013/09/15/are-we-in-a-depression/

 All the hoopla about gov. economic statistic is bad enough. Consider alternatives, remember revisions, adjust forecasts...doesn't help. Now even more confusing, but also with mind-boggling numbers. Billions, Trillions. Like its nothing, not even paper - just digits on a screen.

Instagram sold to Facebook for 1 Billion Dollars. 5 people in a room, $100K revenues, no profit.
SnapChat turned down offer for 2 Billion. 2 people in a bungalo. No revenues.
Twiter is a 22Bil market cap company; FaceBook 117Bil
"Hey, Boichik. How much money do you want to make?"
" A Billion, pa"
15 year old kid. Left me speechless.

I see all this as a steaming pile of HORSESHIT!
Every number they spin around is either a guess, or wish, or lie.
Think about it - You can buy entire Long Bond market for about 1.5bil in margin account. I mean ALL of 30-yr bond open interest! This number is the ONLY real number I need to know.
Everything else - just somebody's agenda.
------------------------------------------------------------------------
 
 Charles Biderman of TrimTabs: GDP & BLS Job Numbers Are Worthless Garbage!


------------------------------------------------------------------------

In a spirit of System 12, here are THE BIG DOGS
10 mega corporations that control output of almost everything we buy.
Now, this is 'statistics' I can get behind....and may-be run with a Scammers for a bit...
http://www.policymic.com/articles/71255/10-corporations-control-almost-everything-you-buy-this-chart-shows-how
http://stockcharts.com/freecharts/candleglance.html?KRFT,KO,PEP,K,UN,JNJ,PG,NSRGY,GIS|C|J[$SPX]

Along these lines here are 6 companies that control 90% of american media, and 4 largest banks:
http://stockcharts.com/freecharts/candleglance.html?GE,NWSA,NWS,DIS,VIA,TWC,TWC,CBS,C,JPM,BAC,WFC|C|J[$SPX]

---------------------------------------------------------------------------------------------
"It isn't the stuff you don’t know that will kill you – it's the stuff you're sure about but is totally wrong that will do you real harm."                   Mark Twain
http://www.zerohedge.com/news/2013-11-26/top-ten-market-mysteries

Friday, November 22, 2013

12 Thoughts on Bigger Picture

The guy asked this: http://evilspeculator.com/?p=39382
...you repeatedly carry the banner saying we're all screwed....  there are some good minds here & I'd like to see a little discussion on the matter sporadically about long term methods to prepare...

This is a bait I can't refuse...lol
Here are some thoughts generally, and also about finances and investments.

Saturday, November 16, 2013

1800

Holly Shit !  1800!
This thing is going parabolic, full retard to upside.

--------------------------------------------------

I've been looking at this Weekly Nasdaq A/D line for months. Its kinda different from other internal indicators, because it shows a cash build-up phase for all of 2011-2012, with low on Nov 12, 2012 and high on Feb 14, 2011. Projected peak end of July 2014. Reliability of this analysis is questionable, T-Theory had alot of misses lately, it may be unsuitable for run-away bull market conditions.

Of note (and may-be more actionable) is a negative divergence in oscillators between July and October peaks of A/D line. Daily version of  Nas A/D Cumulative plot also shows this divergence.
It's been my (non-scientific...lol) observation - this rally sucks.
Nasdaq A/D T 11/2012
http://stockcharts.com/h-sc/ui?s=$NAAD&p=W&yr=3&mn=0&dy=0&id=p26632581400
-----------------------------------------------------------------------

http://www.zerohedge.com/news/2013-11-17/taleb-blasts-bernanke-greenspan-warns-debt-raises-risk-catastrophe


ForeignAffairs


-------------

Update 11/26/2013
Just to illustrate how illiquid this market has become, here is a 5 minute chart of E-mini S&P contract ESZ13. Overnight markets are notoriously illiquid, as seen 10pm to 2am. Surprisingly similar price action clearly visible during previous day session - between 10am and 2pm, and especially so around  after 12pm and again around 1pm.


And again, even worse, on 12/10/2013

I have another personal observation. I've been watching ES streaming live chart for years. Its a lively, active contract, and machines loved it. You can still see them working at open and close, when candle starts jumping at incredible rate, bid/ask size fluctuates greatly, and trades come in 1000's of contracts. Other than that, I have not seen bot activity in Months!

 I am sure they are still there, executing strategies for arbitrage and working large orders in a way that it doesn't move markets much. I just don't see them the way I used to. Did machines walked away, or did they kill each other off, or may be they just waiting for command? That I don't know. For better or worse, the nature of this market has changed. I don't know what it means to me and my own Systems. That's all.

Tuesday, November 12, 2013

Spring to Action

Spring of 2014.
New action plan calls for a major change less than half a year from now.

This day-time job of mine is killing me. Makes me afraid of change, unable to act, old. Sometime during this past year I started feeling stuck, drowning in endless routine, scared of the world and very pessimistic. This must change, otherwise nothing better will ever happen.

The side-gig has been a great financial help this year. So much so, it almost doubled my income. If it will continue next year, I will be able to make ends meet during the busy season April thru October. This is my window of opportunity. Although it remains to be seen, I am fairly confident that jobs will come thru. I should know more sometime in February. Then I can give a generous notice at work, train a replacement, maybe stay part time for few weeks. I want to leave on a high note, just like I did in a past.

Timely quote I found on http://blog.stocktradersalmanac.com/ (Thanks Jeff)
"Self-discipline is a form of freedom. Freedom from laziness and lethargy, freedom from expectations and demands of others, freedom from weakness and fear, and doubt."
—Harvey A. Dorfman (Sports psychologist, The Mental ABC's of Pitching, b. 1935)
 I am going to need that 'self-discipline'. The time freed-up from dead end day-time job will have to be used productively. 

-----------------------------------------------------------
UPDATE 1/19/2014
Time flies. Over past two months I was able to formulate a pretty good game plan and set things into motion.
I gave notice at work last week. Surprisingly, my bosses seems a little panicked, but didn't offer me pay-raise as an incentive to stay. Guess I am not as valuable, as I thought... he-he. They promised to find a replacement by mid-February. I figure it will take a month or two to train, so I am looking at April. Freedom is so close, I can almost taste it.

But first things first. As one of my favorite 'Characters', Captain Vrungel pointed out: "How you name a boat, is how it will sail." So here it is:
Bergamot Capital Management
I like it!

The mission of BCM is to create and manage a life-changing generational wealth.
Nothing less will do.
There is an important condition, that may be an impediment to fast success. No partners, no outside investors. I put in all the labor, I will reap all rewards. May take me a bit longer, but 'overnight success' always requires years of hard work anyway. I experienced that before, at the height of  MSPV, it was very rewarding both financially and emotionally.

I don't want to dwell upon rise and fall of MSPV. I am at fault as much as my partner, who neglected his duties for years, leaving me with abnormal share of work, yet collecting equal compensation. It was I, who failed to recognize importance of  technological changes in early 2000's. Social and economic changes that followed kinda destroyed that industry anyway. In hindsight, I could have done something about it..., but I didn't. MSPV closed its doors almost 5 years ago, to my credit it was a graceful exit. No bankruptcy, no debt, no stiffed creditors. I did waited until "fat lady sings", so I have nothing to show for a 20+ years career.

Two recent experiences with 'investors' made me change my mind about outside money. Especially liquidation of Flagship account in October 2012, which was a very dramatic experience. It took me months to recover psychologically. I don't really care that the guy lost money, as it was entirely his doing. He decided to pull money during less than 15% drawdown, and as I later find out - he didn't really even needed that money, just didn't want to 'play' any more. Obviously, I can't tell what would happen to that account otherwise. But here is what happened to LB account (which I traded almost in parallel to Flagship) - by beginning of 2013 it not only recovered all losses, but was already in profit. LB became my main account and been pushing new equity highs ever since.
Muppets always manage to shoot themselves in a foot.
I don't want any part of it.
And that's that.

--------------------------------------------------------------
http://stockcharts.com/freecharts/candleglance.html?$CEX,TBT,SDS,SRS,SKF,DVA,NM,KEX,TSCO,HRL,BG,CCJ|B|P5,3,3
http://stockcharts.com/freecharts/candleglance.html?SLV,GDX,SIL,FNV,RGLD,TRX,PPP,AG,SLW,FCX,AMLP,SCO|B|P5,3,3
http://stockcharts.com/freecharts/candleglance.html?TBT,JJG,TSCO,DDD,SSYS,IGE,JJC,PALL,CCJ,TSLA,FB,SCTY|B|P5,3,3
http://stockcharts.com/freecharts/candleglance.html?IMAX,VNM,EEM,YELP,NM,SEA,CG,XLF,QQQ,IWM,TAN,CEF|B|P5,3,3

http://stockcharts.com/freecharts/candleglance.html?ASPS,OCN,CXW,GEO,SKYY,STMP,JJG,MOO,MON,POT,MOS,VNM|B|P5,3,3
http://stockcharts.com/freecharts/candleglance.html?CVV,NLR,CCJ,DNN,URRE,REMX,MCP,TAS,EGLE,GNK,BALT,SBLK|B|P5,3,3

Top shippers:
http://stockcharts.com/freecharts/candleglance.html?sea,kex,tk,ckh,stng,sfl,drys,cmre,nvgs,nmm,glog,dsx|B|P5,3,3


Wednesday, November 6, 2013

Twiter IPO

Finally, this day has come!
Actually its getting 'priced' today, but will start trading tomorrow.


-----------------------------------------------------------------

IPO market is super hot. Companies coming in droves, with no revenues or profits, and surely double on a day of IPO. If I was ever looking for an event that could mark the top of this bull market... TWTR would do. What top? This is the 4th biggest bull market in modern history. Tulips, yep

Since before Gov shutdown, I am having a hard time catching any data releases. There is very little discussion on Bloomberg and NPR. Admittedly, I watch even less news than before, but not completely cut out, so something should have gotten to me. OTOH, ZH featuring articles about major misses and deterioration of all kinds of economic data, or at-least parts of it.

btw, I am reading ZeroHedge on purpose. There is no other website I know of, that offers real important news fast, plus analysis of economy and financial markets in real time. The only drawback is that Tyler offers it with a bit more hysteria than I would prefer, and with definite perma-bear bias that I share at this time (never mind that more than half of my portfolio is long at this time).

From ZH: here are dates of tops and bottoms of all bull and bear markets from 1929
Field of research is narrowing. Air is really thin up here
this the fourth biggest bull market in US history
http://www.zerohedge.com/news/2013-11-04/4616-sp-feds-ultimate-goal

--------------------------------------------------------------------------------
There is going to be a 'scheduled' electric grid shut-down on November 13-14 to test US/Canada electric grid. info is very scarce, mostly rumors.
11-13-13 Another date too easy to remember (like 9/11, 7/7 etc)?
Also it seems too easy to make parallels to other false-flag events of recent past and how gov ... and bla-bla-bla
I asked an opinion of RedDragonLeo - a major doomsday expert, numerologist, Legatus watcher etc. Guy is very skilled and called in advance every major top over past couple of years, except none of that ever worked. So much so, he had to resort to penny stock pushing/pumping... very sad.
Red replied here: http://reddragonleo.com/2013/09/28/the-stage-is-being-set-for-a-possible-3000-point-drop-in-the-dow/#disqus_thread  
Here is an excerpt:
"I heard about that electric grid shutdown too but so far ever last thing predicted since about 2009 forward never happened. We all got scared with Planet Nibriu, Mayan Prophecy of "the end" in 2012, and dozens of other scary forecasts... but none of them happened.  I don't think this one will either...
 ...While a pullback is still likely to happen I'm starting to think that they are going to rally this up much higher then we believe possible next year, and maybe the year after that too? While you can't trade off what Lindsey Williams says I do believe his statement that the elite aren't done creating enough debt yet...
... The next meeting is Feb 6th-8th, 2014 but until we top 2000 SPX I wouldn't even think for a minute that the "real crash" is coming...."

 Like I said, Bears are Extinct.

------------------------------------------------------------------------


I don't think i mentioned it before in this journal, but there seems to be an almost a determined effort to destroy financial industry. Knight, PFG, MF Global, SAC etc are gone; and numerous cut backs of trading desks across financial instruments. Not to mention S&P Chicago pit, now almost deserted.

Banks aren't helping themselves either, as widespread market manipulation scandals come to light.
Here is Matt Taibbi of Rolling Stones:
 "The only problem is that the scale of the misdeeds in these various markets is so enormous that even the most half-assed attempt at regulation will cause a million-car pileup...If they're guilty, they're done."
http://www.rollingstone.com/politics/blogs/taibblog/chase-isnt-the-only-bank-in-trouble-20131105

-------------------------------------------------------------

This is how this shit really works these days. The real pro's of Wall Street, the modern day market makers, 'specialists' - algorithm builders. Complex system of markets is more complex than ever.
http://youtu.be/GEAGdwHXfLQ


http://www.zerohedge.com/news/2013-11-04/exposing-wall-streets-hidden-code

-----------------------------------------------------------------------------------

ECRI's Lakshman Achuthan on Bloomberg
"we believe a US recession began in 2012"
 

Wednesday, October 30, 2013

Bears are Extinct

This discussion was here: http://evilspeculator.com/?p=39044#comment-1103748606


i Bergamot

bears are extinct

"Extinction" from Wiki:
In biology and ecology, extinction is the end of an organism or of a group of organisms, normally a species. The moment of extinction is generally considered to be the death of the last individual of the species, although the capacity to breed and recover may have been lost before this point.

How will forest survive without these 'species'?
Or may be this time is different...?
Right

Monday, October 14, 2013

Third Week of Gov Shutdown

Government is really not completely shot down. ZH said that 83% still operational. State and local are working, but still... Treasury will run out of money this week. It happened before and always resolved itself.
“Many people want the government to protect the consumer. A much more urgent problem is to protect the consumer from the government.”
~ Milton Friedman
Positions:   Almost 30% cash
http://stockcharts.com/freecharts/candleglance.html?SLV,GDX,SIL,FNV,RGLD,TRX,PPP,AG,SLW,PGH,AMLP,SCO|B|P5,3,3
http://stockcharts.com/freecharts/candleglance.html?$CEX,SDS,SRS,SKF,DVA,NM,KEX,TSCO,HRL|B|P5,3,3

Entire Precious Metal (PM) portfolio is under water, with TRX, SIL, RGLD, GDX down 25%+. This PM trade is failing and, barring a miracle recovery, will have to be liquidated.

Watch list :
http://stockcharts.com/freecharts/candleglance.html?TBT,JJG,TSCO,DDD,SSYS,IGE,JJC,PALL,ccj,TSLA,FB,SCTY|B|P5,3,3
TSLA and FB no re-entry. Info only

http://www.valuewalk.com/2013/10/jim-chanos-wsj-conference-full-speech-video/
Jim Chanos of Kynikos Associates.Talks about China, how hard to be a short seller (yea, no shit). "...its a celebrity market - its who is buying a stock , not why..."  MLP and REIT's