Daily Global Economic Calendar

Real Time Economic Calendar provided by Investing.com.
Showing posts with label Cotton. Show all posts

Thursday, July 11, 2013

Positions

Geomagnetic Storm continues for forth day non-stop. Its felt all around.
I received new funds for main account (LB). Now I should have enough money to run System 12 with single unit size, which is half of my standard position size.
I also got a new account (Z) to manage. Its very small, but has dual purpose. About 20% to be invested in Marijuana stocks, with the rest (only 3 full positions size) into dividend and interest producing instruments.

This is one helluva rally since June 24 bottom 1560SPX, up 100 points and getting overbought.
Is this a new structural bull market that will last for 20 years? That's what everybody is talking about.
I still have doubts.

BOT:
7/5 - DDD 46.61 Half pos. Wanted to get it for a long time, but always miss a good entry point. Want more.
7/8 - FB 24.67 Half pos. Its like 5th time I buy it in 25 area.
7/10 - TBT 76.50 1Full pos. Adding to half pos, now I have 1.5 - too much - and it doesn't look good at close.
7/10 - DDD 47.89 Half pos. Adding on a way up.
7/10 - AMPL 18.02 Also in new Z account.
7/12 - TZA 26.19 Half pos of 3x short if IWM. May add more. Looking for 2-3 days down to under 100IWM.
7/19 - NM 5.73 Adding half pos on a way up. Now i have full pos on.

SLD:
7/17 - TZA 25.62 Stop out for small loss - getting run over by bulls. Next time using TWM (2x short Russel2000) for less leverage and uniformity of positions.
7/18 - SRS 19.42 Sold way past any reasonable stop for 8.5% loss.
7/18 - SDS 36.89  Half stop-out.

7/15 - dividends received CCJ, PGH
7/19 - dividends received RGLD

http://stockcharts.com/freecharts/candleglance.html?SLV,GDX,SIL,FNV,RGLD,TRX,NM,TK,TBT,VNM,AMLP|B|P5,3,3
http://stockcharts.com/freecharts/candleglance.html?$CEX,BAL,JJG,SDS,SRS,TZA,EWJ,CCJ,TSCO,DDD,FB,SCTY|B|P5,3,3

Positions with cost basis size. (including commissions)
 JJG   1.03    This is my 3rd time going for grains from this post(link) . Since 1/8/2013 I only lost money on it, current position down 5%. I am being stubborn. Watching 48  for support.-- sliced thru it on 7/24, now watching for reaction. We are in or around 3-year lows on grains and all agriculture (via DBA).
BAL  0.55    I first bought Cotton at 56-57 in March, and lost 10% with exit 51.66 on 5/23 here(link). Ultimately support 50 held and 55 was retaken, and weekly chart still looks good. Then I bought Half pos size for 54.58 on 7/3 here(link) to see if I can trade it quicker, but maybe I not going to have to. Being right and loosing money... Hmm.... PFTargets on both sides, but longer term still 89

 NM  0.94  ER 8/19.  P/E 4!  P/B 0.49! My main concern was very high volume 10%+ moves since May 20. Makes it impossible to have a close stop, but it held nicely sideways, although with some Volume Profile (VP) deterioration.  PFT (5.40 met); 6.55; 7 and 7.50
TK 0.94   ER 8/5. Bot on 6/17 for 40.11. That was late stage breakout that failed on 2nd day, since then recovered. Possibly trending LVM, with some of the lowest Volatility in Main Account 1.62%W; 1.88%M. Need to go to 42 to confirm. Cluster of upside PFTargets 43; 45.75; 49, followed by 58.50.
Shippers are a strong group that nobody is talking about, even with BDI on a rise. Here is more: http://stockcharts.com/freecharts/candleglance.html?$BDI,SEA,KEX,TGP,TOO,TDW,GMLP,CKH,CMRE,STNG,DSX,drys|C|C20

 FNV 1.05  ER 8/7amc
GDX 1.49
RGLD 0.57  ER 8/8bmo
SIL   0.53
SLV  0.97
TRX 0.51  8.7% of float short. SR 19!

AMLP 0.96
CCJ 1.06  ER 8/1bmo. No shorts. On a weekly chart its a box 22-23 on top and 16.50-17.50 on bottom. Good VP. Generally anything north of 16 is ok with me, but for now I see support 21-20.50; my stop 19.75. If hit will look to pick a bottom of that box.
DDD 1.03  ER 7/30bmo.  27% of float short! SR 5.7
FB 0.50 ER 7/24amc.  No shorts.
EWJ 1.02
FSCHX 0.5
SCTY 0.51  ER 8/5.  17% of float short, but SR only 1.8. Price stands at 70% above 200dma and up 350% from 52W low - BEWARE!
TSCO  1.15 ER 7/24amc. I think its a confirmed trending LVM, with 2.09%Weekly and 2.22%Monthly volatility.
VNM  0.52.   If 18 is lost, I have to be out.

SDS    0.92
SRS  1.06  First I shorted Real Estate on 6/19 here(link) and stopped out with small loss. Then I took failed breakout on 7/3 here(link). Then it gaped past my Close stop above 67IYR on 7/11 and I exited only to buy it back next day at exactly same price. Effectively, SRS has 21.21 cost basis and a complete clasterfuck.
TBT  1.57
TZA 0.53

Incidentally, JJG, all gold and short positions would be disqualified under rules of System12 (under 200dma); also VNM, while barely qualified, still would not be available (under 50dma).

Monday, April 22, 2013

Positions, Bergamot T Out

Conservative Bergamot T run out in beginning of April.I arranged these center-posts back in January in this post (link).
Conservative T is anchored into violent V-shaped November bottom, and proved correct. Now the remaining questions are: will this be a double top with  higher or lower low, or some kind of "Null Echo" effect, or may be longer T into summer is not correct at-all. There where questions about validity of December center-post, because Nov 15 and Dec 28 bottoms are too far apart.
That aside, I consider this Bergamot T project a success. It guided me just fine since beginning of the year and I am looking forward to doing this again sometimes in future.

BOT:
4/9 - TRX 3.62 1/4pos
4/12 - HDGE 17.45 Half pos
4/18 - TSCO 105.79
4/18 - TRX 2.60 1/4pos
4/18 - SRS 19.65 Half pos
4/18 - SCTY 20.18 Half pos
4/18 - IMAX 27.74 Half pos
4/18 - HDGE 18.29 Half pos

Dividends received 4/12-4/19: CCJ, RGLD, Chemical Mut fund: $49.42 (whoopty doo)

Positions:
http://stockcharts.com/freecharts/candleglance.html?$CEX,TSLA,BAL,NIB,QID,SDS,HDGE,SRS,FB,MON,tsco,IMAX|B|P5,3,3
http://stockcharts.com/freecharts/candleglance.html?SLV,GDX,SIL,FNV,RGLD,trx,scty|B|P5,3,3

 Here are size and cost basis (incl commissions). 57% invested. Silver and PM miners group is 12%+ allocation, and losing 2.5% of account.
 
BAL  - 56.64 I was expecting Cotton to find support by now. More support down to 50. Weekly chart looks great - buyable dip right now. PFTargets: 51.50; longer term 89
FB    - 26.20 Chopping in a box. Support 24.70-25.70. Volume Profile (VP) improving in April.
FSCHX- 96.05 Half pos basis (25% mark-up)  $CEX stop under 368. CEX PFT 370met.  More PFT 450; 508-512.
IMAX - 27.87 Half pos.    This is possibly a Low Volatility Mover (LVM). Not a single close below 5wema for 4 months. Nothing overbought. I wanted to catch one of these for a long time. Trailing loose stop 25-26. Looking to add on strength above 28.     PFT 33; 37; 43.50
MON  - 107.17 Loss of momentum and weakness on VP. Support 97.50-98.50. PFT 98.50; 111; 133
NIB  - 29.39  Cocoa started on Mar 15, 2013 in this post (link), I bot on 3/20 and 28.  Support 29-30. PFT 37; 56
SCTY - 20.28 Half pos  PFT 28.50
TSCO - 106.06  PFT 108 (met); 126; 154
TSLA - 35.50 Half pos (38% mark-up) Short ratio came down to 13 from 21, but still 42% of float short!  PFT 41.50 and 52 met. More PFT 61; 67; 100

HDGE - 17.91
QID  - 26.49
SDS  - 45.24
SRS - 19.75 Half pos

SLV  - 28.20 Half pos
GDX - 37.61 Half pos (-23% dr-down)
SIL  - 17.80 Half pos
FNV  - 48.63 Half pos
RGLD - 68.96 Half pos
TRX -  3.04 Half pos  (-10% dr-down)

In The News:

GOLD - 4/23/13
NEW YORK--Goldman Sachs on Tuesday closed its recommendation to "short" gold, telling clients to exit bets on lower gold prices.
The bank had told its clients to bet on lower gold prices April 10.
 "Our bias is to expect further declines in gold prices on the combination of continued ETF outflows as conviction in holding gold continues to wane as well as our economists' forecast for a reacceleration in U.S. growth later this year," they said.

4/23/13 - Small Flash Crash
AP Twitter account got hacked and planted a story that two bombs detonated at the white house, injuring Obama. Lasted 5 minutes - 300,000cars ES and 50mil shares SPY. 
"Boss, we need to check the machines
No
Pleeease, we don't even know if they are working
No
Pretty please, just a few minutes
Ok, Ok, 5 minutes only
Yee-ha, hit it Lloyd!"

Thursday, April 18, 2013

Market Condition

Confidence Indicator (CI) popularized by late great Terry Laundry.He had a whole theory behind how and why it works, tested and researched for many years. The way I use it is simply a ratio of High Yield Bonds overweighted in Technology to Treasuries 15/25 years to maturity. Risk on / risk off so to say. It has an excellent success rate for divergences of this ratio to S&P500 leading to significant downside in Equities,  just like what it has now. Present divergence in price was preceded by internal weakness of indicator itself, as evident by MACD divergence.

 Bunch of other divergences present itself. New High to New Low Ratio gone negative for the first time this year. Less than half of S&P500 stocks are above 50DMA (per $SPXA50R). This is with SPX only about 3% off the highs! Also a deterioration is visible since March
Small caps and Naz100 are weak and leading down. Financials XLF dipped below 50DMA ahead of SPX.
Naz A/D indicator is very weak.

................................................................................................................
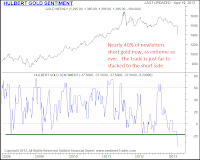
 April 19  GOLD Sentiment
40% of newsletter writers recommend shorting Gold - this is most bearish since 2008

April 18   GOLD - Physical demand
           The U.S. Mint in April has sold 153,000 ounces of American Eagle gold coins, the highest in almost three years, after futures prices started the week by plunging the most since 1980.
Sales have more than doubled from March and surged sevenfold from a year earlier, data on the Mint’s website showed. The amount for all of May 2010 was 190,000 ounce.
          This week, retail sales and jewelry demand soared in India, the world’s top gold buyer, and China, the second-biggest, after futures in New York slumped into a bear market, touching the lowest in more than two years. Coin sales also surged in Australia.

April 17 GOLD
CME Hikes Gold, Silver Margins By 18.5%. Only big boys are allowed to play.

April 15, 2013 Monday.  GOLD  falls $150 to low 1335 (close 1361). Half of that drop happened overnight before US market opened.  Volume 657090 cars !!! Highest volume of that day came shortly after open, as gold broke 1400

April 14  GOLD - HFT 


The implication is that HFT bots driving gold down. They are perfectly designed to chew through bid structures, and that's what you see above.  They are 'digesting' all the orders that were still on the books for gold, to remove them so that lower and lower stops could be run.  Charts and explanation are from http://www.peakprosperity.com/blog/81535/gold-slam-massive-wealth-transfer-our-pockets-banks
I had no idea that Gold is liquid enough to handle these machines.

April 12, 2013  Friday.    GOLD  falls $88 to 1501
Goldman Sachs now expects gold to fall to $1,450 an ounce by the end of the year; the company’s original forecast was around $1,810. By the end of 2014, the company believes the precious metal will falter even more, falling to $1,270. Goldman’s 12-month gold outlook also fell from $1,550 to $1,390. Goldman also cut its short-term outlook, cutting its three-month forecast from $1,615 to $1,530 an ounce.

COTTON
 Beijing–through the China Cotton Association–has agreed to extend its stockpiling program of the commodity, and will renew cotton stockpiling from September 2013 to March 2014, with no upper limit on purchases.

...............................................................................................................
I will start to track some of the news. Not because it helps in routine trading. It doesn't. But because markets can't fall without some "shaking of the tree". News cycle has been very quite and benign ever since the beginning of the year, which is unnatural. I strongly believe that some of the news are in fact a "warning shot across the bow", something that changes the balance of things, but often understood only with benefit of hindsight. Still I remember very clearly that I saw right thru all the BS about Jerome Kerviel back in 2008. Kid was softly setup to take a fall for some 500 million in losses for Société Générale (SoGen is a europian equivalent of Goldman Sachs), allowing the bank to get out of massive position in US markets right before Sub-Prime crisis began.
The idea is to plot biggest news on a chart for future use.

In The News:

April 16
Letters containing deadly ricin poison received by Presidents office, some senators and judge. No casualties. Suspect apprehended 2 days later and appears crazy.

April 15 Boston Marathon Bombing. Chechen's involved.

April
        North Korea threatens nuclear attack, severs ties with South Korea. TV is full of cartunish videos of their mid-20th Century army and rockets and that fat kid (Lil Kim). It did get people scared.
        Congress coming back from vacation, get a budget from president that is bigger than before, shots down gun legislation. Starting to shake the news a bit.
        Bitcoin bubble. 40 to 265 in days, than back to less than 80 in hours.
        Japan announces that not only they will print money, but also buy bonds, stocks, ETF's and real estate for next 2 years.
        Numerous announcements of local and other taxes going up. Cost of doing business is thru the roof.

Beginning of April - Bird Flu outbreak in China. Some people died. Human-to-human transmission suspected, but denied by Chinese authorities.

Beginning of March - Cyprus bank crisis. Bank holiday, depositors looted, bailout failed, followed by rumors of their gold reserve sales. Germany approved bailout on April 18