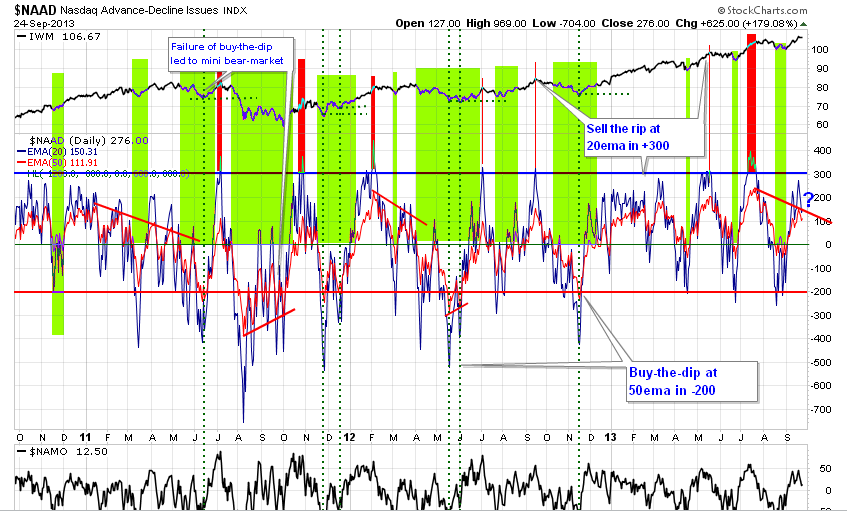

http://stockcharts.com/h-sc/ui?s=$NAAD&p=D&yr=0&mn=6&dy=0&id=p44764799133
http://stockcharts.com/h-sc/ui?s=$NAAD&p=D&yr=3&mn=0&dy=0&id=p74347576066
http://stockcharts.com/h-sc/ui?s=$NYAD&p=D&yr=1&mn=0&dy=0&id=p39294453226
http://stockcharts.com/h-sc/ui?s=$NYMO&p=D&yr=1&mn=0&dy=0&id=p04197492070
http://stockcharts.com/h-sc/ui?s=$NYMO&p=D&yr=1&mn=0&dy=0&id=p89369245088
http://stockcharts.com/h-sc/ui?s=$NYUD&p=D&yr=1&mn=0&dy=0&id=p81565637438
Volume Oscillator T's continue to be unreliable in 2013. T4 and T6 missed the tops, and T8 is doing something wacky. Admittedly, I couldn't recognize T8 bottom as it happened.
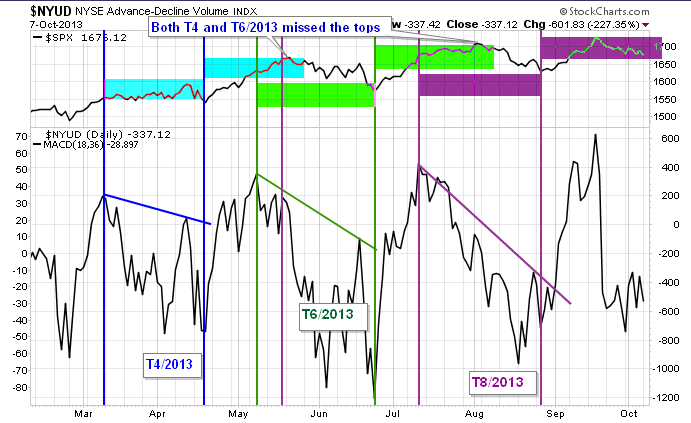 |
| VO T April-September 2013 |
http://stockcharts.com/h-sc/ui?s=FAGIX:VUSTX&p=D&yr=1&mn=0&dy=0&id=p69808339952
http://stockcharts.com/h-sc/ui?s=FAGIX:VUSTX&p=D&yr=1&mn=0&dy=0&id=p02920481296
http://stockcharts.com/h-sc/ui?s=$SPX:$GOLD&p=D&yr=3&mn=0&dy=0&id=p51275941041
$SUPADP $SUPUDP S&P 1500 is a great index for breadth indicators because it combines the S&P 500, the S&P Midcap 400 and the S&P SmallCap 600
Here is a new idea (UPDATE 12/15/2013)
$SPX:$GOLD used not as a ratio, but as SPX priced in Gold, aka Bullshit Indicator.
If its rising - all is good in the land of stocks.
If its falling - stocks are Bullshit!
also trying to look at following ratios without referring to S&P (plot not included in this study)
$SPX:EFA $SPX:EEM EFA:EEM seems to produce at-least 2-3 months trends
It is not necessary to invest in under-performing areas of the World
http://stockcharts.com/h-sc/ui?s=$SPX:$GOLD&p=D&yr=1&mn=0&dy=0&id=p51708175586
http://ibergamot.blogspot.com/2013/04/internals-study.html
MATRIX
Daily http://stockcharts.com/h-sc/ui?s=$SPX&p=D&yr=0&mn=6&dy=0&id=p71533435672
Weekly http://stockcharts.com/h-sc/ui?s=$SPX&p=W&yr=3&mn=0&dy=0&id=p41109488212
Volume Profile http://stockcharts.com/h-sc/ui?s=$SPX&p=D&yr=0&mn=9&dy=0&id=p89183620435
...................In The News..........................
All about gov. shutdown and debt ceiling. General opinion is that its much ado about nothing. They shut government down before, causing some turbulence, but then market quickly recovered. Debt ceiling debacle caused August 2011 collapse. I remember it well - debt-ceiling was lifted at the last moment, but market crashed anyway. So basically we are conditioned for a 'recovery' after....hold on, after what?
Here is ConvictScott: (from here http://evilspeculator.com/?p=38564)
Given that we have the money honeys and affiliated news clowns yabbering about the gubmint shutdown, the odds favor uncertainty with a strong chance of an epic short squeeze.Just the same fucking circus as September 18 "No Taper" announcement. Everybody kinda agreed that 10-15bil taper of fed purchases would probably be good, and thats what fed was talking about all this time. I don't think they know what to do. I think there is a problem we are not aware of. Why? Market topped on that announcement, with general consensus that softness is temporary and recovery after... is most assured.
We have been going thru this nonsense for few years now. I am not sure if its always been like this. I can't learn all I need from history. My problem is that I have been investing during period after 2000, and don't have my own experience of secular bull market. Was it like this? An endless climb of wall of worry?
No comments:
Post a Comment