If you find yourself in a hole the first thing to do is stop digging...
My hole isn't really that big. I've been in much deeper holes, came out ahead and advanced. I'll just keep on digging a little while longer, feeling around for different directions, adjustments, improvements. It takes me almost 2 months to find my bearings here. In isolation. With colossal constructions next door for a first 3 weeks. With massive roof leak (now completely fixed), and most miserable winter I've seen in 20 years. With constantly breaking old car, finally giving up in a middle of highway, in a dark, with kids in a back (I love my new Elantra 30mpg). With me unleashing a short-term ES trading system, and seeing it clown-rape my account. Surprise tax bill. And no cash. I am ready for summer.
This business is trying and taxing, and wears out its participants to ashes. The ones who remain standing and sensibly functioning will make it out. Everybody else are blowing up in massive swings. I reviewed many familiar blogs and forums. Places are incredibly busy, everybody are bearish as shit. Almost like good old days of financial crisis. Except indexes are few percent from all time highs, and most of my stocks are ok, with little damage. We can chop like this for a while.
-------------------------------------------------------
This poor soul lost 195K in 10 days, from January 31 to February 17 this year. I believe its completely true, I believe its a very common experience by now across investment landscape. This is exactly how clean up happens, and by the looks of it, its not over. I know, I've been there... '2010 Disaster'...
http://trainwrecktrader.wordpress.com/
"Good judgment comes from experience, and a lot of that comes from bad judgment", said the same Old Cowboy.
------------------------------------------------------
Earnings season is here.
If I had any short term swing positions, I would drop them before earnings. I have none.
This is BCM, I want to keep every single one of them thru earnings, unless sudden collapse, crush or snow. How else do I realize long-term gains? Expectations adjustment (both ways) happens most often on earnings release.
LO is first on 4/24.
http://stockcharts.com/freecharts/candleglance.html?LO,WDC,GEO,CCJ,FXI,GDX,VNM,CHKP,FSLR|B|P5,3,3
As for new positions, I am extremely risk averse, would rather not buy anything before earnings, or at least see how related stocks react to announcements.
The strongest sectors seems to be Energy, Staples and Utilities.
The most damaged are Health Care (thru biotech, no doubt) and Cyclicals(?);
Financials looks ominous.
Solar activity is moderate, but with unusually many geomag storms. Lunar eclipse, followed by solar eclipse on 4/28, with Cardinal Cross in between (some kind of unusual planet alignment thingamabob). Passover and Easter are together this year. I got my tin hat on...
Time to plant the garden and sow the seeds...he-he
----------------------------------------------------
This is
Arnott Overlay (AO).
Based on strategy cross-selection, these are the best stocks ever. I want to own them in System9, but technical's are discouraging for all. Looking for entry.
http://stockcharts.com/freecharts/candleglance.html?SPY,RSP,PRF,XOM,GE,WFC,MSFT,JPM|B|P5,3,3
----------------------------------------------------
There is a clever Eddy Elfenbein of CrossingWallStreet, proclaimed a 'best buy-and-hold blogger', with his Buy List. A collection of 20 stocks, set in a beginning of the year. He mentioned that not all should be held continuously. This fits with my efforts to trade opportunistically the very best, sound businesses. This gig is hard enough, I need all the tilt I can get. Still I give only limited weight to fundamental factors - this is a game of speculation, not accounting.
http://www.crossingwallstreet.com/
Eddy Elfenbein Buy List (EEBL) with equal continuous allocation (like index...he-he) beat S&P500 every year since 2006. I like his picks, good mix. Some familiar faces - IBM, MSFT, WFC from S12BCM, notable is ORCL here again (fresh one in SD from last month).
Well done, Eddy! Thanks
http://stockcharts.com/freecharts/candleglance.html?$SPX,IWM,VTV,VUG,AFL,BBBY,CA,CTSH,BCR,DTV,EBAY,ESRX|B|P5,3,3
http://stockcharts.com/freecharts/candleglance.html?FISV,F,IBM,MCD,MDT,MSFT,MOG/A,ORCL,QCOM,ROST,SYK,WFC|B|P5,3,3
After removing what I already have, these seems the best now, but I am just watching how they all react to earnings:
http://stockcharts.com/freecharts/candleglance.html?AFL,CA,CTSH,DTV,EBAY,ESRX,F,MCD,QCOM,ROST|B|P5,3,3
-----------------------------------------------------
While on a subject of 'buy-n-hold' and fundamental analysis, how can I forget Old Man Buffet. Here is his top 2 dozen as of end 2013, from WFC 20% to MTB at 0.5% of portfolio:
http://stockcharts.com/freecharts/candleglance.html?WFC,KO,AXP,IBM,PG,XOM,WMT,USB,DTV,DVA,GS,PSX|B|P5,3,3
http://stockcharts.com/freecharts/candleglance.html?MCO,GM,GHC,USG,BK,CBI,COP,LMCA,NOV,VIA,VRSN,MTB|B|P5,3,3
Notable that BAC is not here, but actually its his 5th largest position (thru warrants and shit...).
--------------------------------------------------------
Emerging Markets are going apeshit to upside, against a backdrop of extremely negative news. Action is really all over the world - Asia-Pacific (GMF), Africa and ME (GAF), Latin America (GML) in a big way. All this is not really visible in EEM, maybe due to China, and especially Russia. I've been shuffling some etf's around, here is more:
http://stockcharts.com/freecharts/candleglance.html?EEM,GAF,GML,GMF,AFK,FXI,PGJ,VNM,TUR,RSX,IFN,EWZ|B|P5,3,3
GAF, GML, GMF are really non-tradable, but here is more...dip would be nice:
http://stockcharts.com/freecharts/candleglance.html?fm,ews,idx,eww,eza|B|P5,3,3
Mother Russia is up to no good. Sentiment is extremely negative. Even russian analysts bear-shitting all over their markets for next 2 weeks. Ivan's got it all figured out, they know every move over coming days.
Will
Влади́мир Влади́мирович deliver?
http://stockcharts.com/freecharts/candleglance.html?$RTSI,RSX,CTCM,MBT,MTL,QIWI,VIP,YNDX,OGZPY,SBRCY,NILSY|B|P5,3,3
------------------------------------------------------
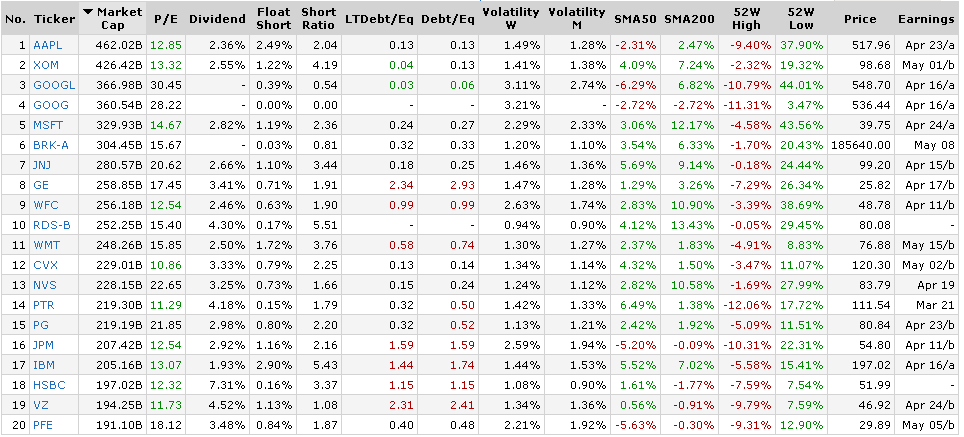
These where found in a different way. Instead of working from theme to
chart, or relying on somebody's fundamental research, I made several scans in Finviz based on certain fundamental and
technical criteria.
2 weeks ago, as I ordered myself to
Charlie Mike (link), I came up with this:
http://stockcharts.com/freecharts/candleglance.html?WDC,XEC,GD,RTN,XLNX,DIS,VLO,INTU,UNP,LLY,PSX,MXIM|B|P14,3,3
The only entry I took is WDC, but almost all are still ok. Notable here is PSX - one of RAFI top stocks.
I am still tuning this thing, its coming up with some familiar names, oils, HUM, ALL and BWA - auto part factory in Michigan with 20K! employees.
Methinks, I dug up enough for now...