Daily Global Economic Calendar

Real Time Economic Calendar provided by Investing.com.

Monday, April 29, 2013

Internals Study

I am attempting (again) to organize a wide array of market internal indicators I use. The problem is - i have them set-up differently at home, at work and at house-by-the-lake. I still refuse to sigh-up for any subscription, including one to Stockcharts-dot-com, where I would be able to keep them set in their Public Lists. So i need to make them compact, and get rid of weak ones.

Here is another problem: T-Theory Volume Oscillator (18,36MACD of $NYUD) is very confusing to me, especially so when using for T's.  I thought its a dead end, but then realized that Im looking at "nested T" - small Volume Oscillator T with center-post at February 25th dip. VO T 2/2013 is about to ran out. Also on same chart: T 11/2012 is the same as BergamotT, but unlike NYMO, Volume Oscillator had a high in mid June and T projected right into Tax-day (give or take a day or two). Green "Irregulat T 4/2013" is missing secondary cash build-up phase and i don't know what to make of it.


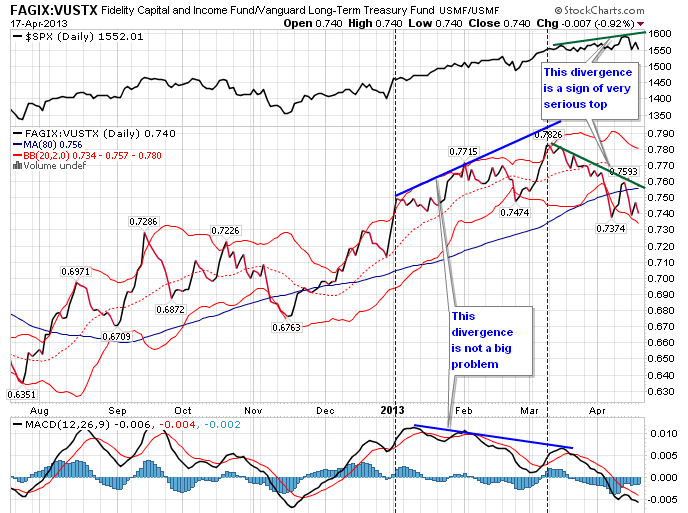
This is all fine with benefit of hindsight, and seems to support endless rotation in sectors of S&P. This rotation is increasingly hard to predict and makes for very unhealthy environment, as evident by Confidence Indicator (FAGIX:VUSTX below) still diverging from S&P. This non-confirmation is already big enough, but can get bigger. Golden Indicator also diverging, but this configuration is very unreliable and I decided to ignore it for few weeks/months.
Two studies below deal with Advance/Decline analysis.
        McClellan Oscillator ($NYMO) is basically 19,39 MACD of  Net Advances, the number of advancing issues less the number of declining issues on NYSE. I don't know what to make of it at this time, except that its pushing upper BBand, but at relatively low level. Percent of S&P stocks below 50MA shows a well pronounced divergence, as more and more stocks cannot get above their 50day MA. I wasn't watching Utilities, Staples and Healthcare that rallied strongly over past few months, and my watch-lists show disproportionate share of stocks that broke below 50MA and even already in their own bear market. Bullish Percent Index is similar, normally it lags by a month or two.

-----------------------------------------------------------------------------

         My Nasdaq A/D Indicator deals with Net Advances in more straightforward way. Its simply 5day EMA and 20day MA of $NAAD. Shaded area are periods when 20day MA is below 0, during which IWM is weak, and its coming back above 0 right now. Also significant lows where made on lower readings of 20dma than most recent in April. Divergence is visible since beginning of the year, and lately it also shows up in weakness of Nasdaq New High / New Low since March.
So I'm asking myself: Whats the bottom line? Really don't know, with so many negative divergences and internal weakness in SPX, Nasdaq, IWM etc, still market is not breaking down. In fact NYMO and My Naz A/D Indicator (MNA/DI) have room to upside and can support a 5-10% rally on major averages from here and last into end of May (if Irregular T 4/2013 works out). 

---------------------------UPDATE-------------------------
Following this post, Market rallied 6-7% and peaked on May 22.
Pretty good analisys....ha-ha
----------------------------------------------------------------

At last here are two charts I watch intraday. The main version of MNA/DI and VIX. Volatility Index (VIX) looks really strange lately and I give it very little attention.
At close inspection I realized that I use 20 day Exponential MA on MNA/DI and tried to quickly redraw shaded areas in same manner as chart above. I will double check again tonight.

Wednesday, April 24, 2013

Full Moon

Full Moon, Lunar eclipse, solar is active non-stop every day.  All we need is a juicy news story.

SLD:
4/25 - SRS 18.60.    (   % loss on Half pos)
4/25 - IMAX 25.95 on earnings. No so much as earnings are bad (I am actually not sure), but it is definitely not a LVM. LowVolatilityMover does't go 4% down and 3% up within one day. Chart is still not bad, I will review it next week. I sold at the top of support zone for   (   % loss on Half pos), so far its still low of the day (2:06pm est), volume is very high.
4/25 - SCTY 23.87 This thing is up almost 20%. Selling 1/4 pos on close stop. Still have 1/4pos on.

I will be out of office tomorrow on 26th. Do i set close or far stops?

April 25, 2013
TSCO earnings. Initial sell off sharply reversed. I need to look into what are they doing right.

HDGE is getting killed, many their top holdings reversing sharply to upside. Hopefully its just a short squeeze. I will give them more time, but not much more.
http://stockcharts.com/freecharts/candleglance.html?HDGE,DB,TCK,GT,CBT,PVH,FDS,CTL,CMA,FFIV,FITB|B|P5,3,3
HDGE UPDATE 4/29/2013. Top holdings. Added FOSL, COH;  dropped FFIV
http://stockcharts.com/freecharts/candleglance.html?HDGE,TCK,GT,CBT,CTL,DB,FDS,CMA,FITB,FOSL,COH,pvh|B|P5,3,3

In the News:

April 24, 2013  -  CYBER ATTACKS
“On April 23rd, Schwab was one of the most recent targets of a “denial-of-service” attack perpetrated by a third party. ... Based on the history of denial-of-service attacks on other companies, we anticipate these attacks may continue against our industry – and us – for some time."
Also on 4/25 many complained about slow internet connection, misquoted charts and some kind of problems with quotes at CME/CBOE.  My price watch list at OX (Schwab) is acting up all day long, but i did not receive any messages. My Streaming Charts are fine, orders where executed without problem.


Deutsche Bank Downgrades Gold Miners     
 Deutsche Bank Markets Research downgraded three stocks, cutting Barrick Gold (ABX) and Kinross Gold (KGC) to Hold from Buy, and lowering their rating for Newmont Mining (NEM) to Sell from Hold. They kept Goldcorp (GG) as a Hold.
 Under a $1,500/oz gold price scenario we believe NA Gold producers equity values become “scissored” between a sharply lower-than-expected gold price and still rising capex commitments/ operating costs/ cresting resource nationalism, leading to large potential shareholder dilution in 2H13. Under $1,500/oz gold price scenario, net present values decline by 21%, with larger drops to prior NPVs seen at Kinross and Newmont (given relative higher cost operations). Under an extreme $1,300/oz gold scenario NPVs fall 78%…

 Barron's Big Money Poll is crazy bullish
74% of money managers identify themselves as bullish or very bullish about the prospects for U.S. stocks -- an all-time high for Big Money, going back more than 20 years. What's more, about a third of managers expect the Dow Jones industrials to scale the 16,000 level by the middle of next year

Tuesday, April 23, 2013

HDGE

HDGE is actively managed short fund with bottom-up, fundamental, research driven security selection process (that's what they say). Expence ratio is 3.3%, only 270mil, no leverage, premium/discount very small.

The idea is this - if we are going into a sizable shit-storm, I want to be short weakest companies. Letting somebody make a picks? Lets see what they can do. So far not very impressive, but it is a bear ETF in a bull market
 
http://advisorshares.com/fund/hdge


Here are top holdings as of 4/22/2013. They look bad, so its good!

http://stockcharts.com/freecharts/candleglance.html?HDGE,DB,TCK,GT,CBT,PVH,FDS,CTL,FFIV,FITB|C|J[$SPX]
Other shorts as of 2/5 and 3/31
http://stockcharts.com/freecharts/candleglance.html?clf,cmg,prgo,vale,dfs,now,coh,win,bhi|C|J[$SPX] 


John Del Vecchio and Brad  Lamensdorf are managers. John even wrote a book about short selling. Amazon reviews are pretty good.
                 

Here is Brad  talking down FOSL, CTL, GT. Pushing your book, ata boy.

Monday, April 22, 2013

Positions, Bergamot T Out

Conservative Bergamot T run out in beginning of April.I arranged these center-posts back in January in this post (link).
Conservative T is anchored into violent V-shaped November bottom, and proved correct. Now the remaining questions are: will this be a double top with  higher or lower low, or some kind of "Null Echo" effect, or may be longer T into summer is not correct at-all. There where questions about validity of December center-post, because Nov 15 and Dec 28 bottoms are too far apart.
That aside, I consider this Bergamot T project a success. It guided me just fine since beginning of the year and I am looking forward to doing this again sometimes in future.

BOT:
4/9 - TRX 3.62 1/4pos
4/12 - HDGE 17.45 Half pos
4/18 - TSCO 105.79
4/18 - TRX 2.60 1/4pos
4/18 - SRS 19.65 Half pos
4/18 - SCTY 20.18 Half pos
4/18 - IMAX 27.74 Half pos
4/18 - HDGE 18.29 Half pos

Dividends received 4/12-4/19: CCJ, RGLD, Chemical Mut fund: $49.42 (whoopty doo)

Positions:
http://stockcharts.com/freecharts/candleglance.html?$CEX,TSLA,BAL,NIB,QID,SDS,HDGE,SRS,FB,MON,tsco,IMAX|B|P5,3,3
http://stockcharts.com/freecharts/candleglance.html?SLV,GDX,SIL,FNV,RGLD,trx,scty|B|P5,3,3

 Here are size and cost basis (incl commissions). 57% invested. Silver and PM miners group is 12%+ allocation, and losing 2.5% of account.
 
BAL  - 56.64 I was expecting Cotton to find support by now. More support down to 50. Weekly chart looks great - buyable dip right now. PFTargets: 51.50; longer term 89
FB    - 26.20 Chopping in a box. Support 24.70-25.70. Volume Profile (VP) improving in April.
FSCHX- 96.05 Half pos basis (25% mark-up)  $CEX stop under 368. CEX PFT 370met.  More PFT 450; 508-512.
IMAX - 27.87 Half pos.    This is possibly a Low Volatility Mover (LVM). Not a single close below 5wema for 4 months. Nothing overbought. I wanted to catch one of these for a long time. Trailing loose stop 25-26. Looking to add on strength above 28.     PFT 33; 37; 43.50
MON  - 107.17 Loss of momentum and weakness on VP. Support 97.50-98.50. PFT 98.50; 111; 133
NIB  - 29.39  Cocoa started on Mar 15, 2013 in this post (link), I bot on 3/20 and 28.  Support 29-30. PFT 37; 56
SCTY - 20.28 Half pos  PFT 28.50
TSCO - 106.06  PFT 108 (met); 126; 154
TSLA - 35.50 Half pos (38% mark-up) Short ratio came down to 13 from 21, but still 42% of float short!  PFT 41.50 and 52 met. More PFT 61; 67; 100

HDGE - 17.91
QID  - 26.49
SDS  - 45.24
SRS - 19.75 Half pos

SLV  - 28.20 Half pos
GDX - 37.61 Half pos (-23% dr-down)
SIL  - 17.80 Half pos
FNV  - 48.63 Half pos
RGLD - 68.96 Half pos
TRX -  3.04 Half pos  (-10% dr-down)

In The News:

GOLD - 4/23/13
NEW YORK--Goldman Sachs on Tuesday closed its recommendation to "short" gold, telling clients to exit bets on lower gold prices.
The bank had told its clients to bet on lower gold prices April 10.
 "Our bias is to expect further declines in gold prices on the combination of continued ETF outflows as conviction in holding gold continues to wane as well as our economists' forecast for a reacceleration in U.S. growth later this year," they said.

4/23/13 - Small Flash Crash
AP Twitter account got hacked and planted a story that two bombs detonated at the white house, injuring Obama. Lasted 5 minutes - 300,000cars ES and 50mil shares SPY. 
"Boss, we need to check the machines
No
Pleeease, we don't even know if they are working
No
Pretty please, just a few minutes
Ok, Ok, 5 minutes only
Yee-ha, hit it Lloyd!"

Sunday, April 21, 2013

Watch List Cleaner


From January 21, 2013 
Ongoing project to make lists of ETF grouped by industry or affiliation:
(concept still not clear) Must continue. System 12 came out from this. There may be more
http://ibergamot.blogspot.com/2013/01/things-to-do-when-volatility-died.html

Energy Long/Short
http://stockcharts.com/freecharts/candleglance.html?USO,UNG,UGA,SCO,DUG,IGE,XLE,OIH,XOP,AMJ,XES|B|P5,3,3\

Silver
http://stockcharts.com/freecharts/candleglance.html?SLV,PSLV,SLW,PAAS,CDE,AG,HL,SSRI,SVM,EXK,MVG,GPL|B|P5,3,3

Shippers
http://stockcharts.com/freecharts/candleglance.html?$BDI,SEA,KEX,GLNG,TGP,TK,TOO,TDW,GMLP,SFL,CKH,SSW|C|C20
http://stockcharts.com/freecharts/candleglance.html?cmre,matx,nmm,stng,glog,drys,dsx,cplp,nat,nm,dac,sb|C|C20

Agriculture, Grains, Softs
http://stockcharts.com/freecharts/candleglance.html?DBA,JJG,$SOYB,SOYB,$CORN,CORN,$WHEAT,BAL,NIB,JO,SGG,moo|B|P5,3,3
 Agriculture - Chemicals, Machinery; also VMI
http://stockcharts.com/freecharts/candleglance.html?MOO,MON,POT,MOS,AGU,SQM,RNF,AVD,IPI,de,lnn,cnh|B|P5,3,3
Agriculture - Farm Products
http://stockcharts.com/freecharts/candleglance.html?TSCO,ADM,BG,ANDE,AGRO,CRESY,CVGW,CQB,GAGA|B|P5,3,3

Healthcare / Elder care / Specialized Medicine
DVA etc

Private Equity Firms (PE)
http://stockcharts.com/freecharts/candleglance.html?spy,cg,kkr,apo,bx|B|P5,3,3

Consumer
 http://stockcharts.com/freecharts/candleglance.html?$NYA,XLY,VCR,FXD,XRT,RTH,IYC,XLP,VDC,IYK,PBJ,wmt|C|P5,3,3
 Consumer International
 http://stockcharts.com/freecharts/candleglance.html?$DJW,RXI,CHIQ,INCO,BRAQ,KXI,ECON,IPS|B|P5,3,3
 Consumer mega-stocks
 http://stockcharts.com/freecharts/candleglance.html?IYC,WMT,DIS,AMZN,HD,CMCSA,EBAY,COST,TWX,NWSA,TGT,TJX

 Chemical  , also POL
 http://stockcharts.com/freecharts/candleglance.html?$CEX,FSCHX,DOW,LYB,PPG,TPCG,FTK,FUL,EMN,CHMT,MEOH,gra

Emerging Markets
http://stockcharts.com/freecharts/candleglance.html?$ssec,aaxj,FXI,GXC,MCHI,CHIQ,HAO,PGJ,eza,epol,ephe,vnm|B|P5,3,3

Marijuana
http://stockcharts.com/freecharts/candleglance.html?MDBX,CBIS,MJNA,HEMP,PHOT,AVTC,TRTC,ERBB,SRER,GRNH|B|P5,3,3

Games From this post (link) Aug 28, 2012 See notes
http://stockcharts.com/freecharts/candleglance.html?GME,EA,ATVI,IGT,TTWO,game,gluu,ntdoy,sne,pwrd,ntes,cyou

Marketing Services. Mobile advertisement.   From this post (link) Aug 28, 2012 See notes
 http://stockcharts.com/freecharts/candleglance.html?goog,fb,p,yelp,cco,mm,vci,velt,arb,ncmi,ctct,hhs,mdca

Graphite
http://stockcharts.com/freecharts/candleglance.html?CVV,ENTG,GTI,TCK,ZOLT,FDR.V,NGPHF,FCSMF,ENZR|B|P5,3,3

Uranium
http://stockcharts.com/freecharts/candleglance.html?NLR,URA,DNN,CCJ,STHJF,USU,URZ,UEC,urg,urre|B|P5,3,3

Assorted.  Alot of duplicates here.
http://stockcharts.com/freecharts/candleglance.html?SPY,IGE,sea,DRYS,ORB,GSVC,DDD,RGR,yelp,soda,xlk,xlf|B|P5,3,3
http://stockcharts.com/freecharts/candleglance.html?NIB,HYG,PCY,EEM,ifn,EUO,XHB,IYR,KORS,SWI,XLB,KOL|B|P5,3,3
http://stockcharts.com/freecharts/candleglance.html?SPY,GEO,IGE,TAN,SCTY,DRYS,UGA,ORB,GSVC,DDD,moo,rgr|B|P5,3,3
http://stockcharts.com/freecharts/candleglance.html?SEA,NIB,XLK,XLF,xle,oih,ige,YELP,soda,hyg,pcy,eem|B|P5,3,3
http://stockcharts.com/freecharts/candleglance.html?SPY,GEO,KOL,SLX,IGE,TAN,SCTY,DRYS,UGA,ORB,GSVC,DDD|B|P5,3,3
 http://stockcharts.com/freecharts/candleglance.html?SPY,XRT,XLE,XLB,remx,lysdy,EARH,$DJAKC,JO,JVA,XLV,IBB|B|P5,3,3
http://stockcharts.com/freecharts/candleglance.html?plce,tif,ua,lulu,pvh,ann,gps,chs,ltd,omx,med,che|B|P5,3,3
 http://stockcharts.com/freecharts/candleglance.html?LNG,PHO,WTR,PLL,FSLR,BYI,MGAM,GRA,PPG,OMX,MANH,SNDK|B|P5,3,3
http://stockcharts.com/freecharts/candleglance.html?LNG,DDD,GME,SD,IDTI,CRUS,MD,ARII,SHLD,ALGN,HCN,mgam
 http://stockcharts.com/freecharts/candleglance.html?SFD,BX,TCB,DVA,MRVL,NTAP,GLW,CAH,ELN,TCK,RBA,OMPI
 http://stockcharts.com/freecharts/candleglance.html?xhb,aec,clp,nov,vlo,xco,xle,oih,ige,manh,sfly
 http://stockcharts.com/freecharts/candleglance.html?EA,IRBT,CAJ,FB,LXK,NILE,GME,CMG,COH,DECK,GRP,tif
 http://stockcharts.com/freecharts/candleglance.html?CCJ,TSLA,MON,MOS,GRA,MR,ATHN,ROST,TJX,SBH,YELP,FB
Also here http://ibergamot.blogspot.com/2012/04/watch-list-cleaner.html


Doc Barter short 1/18/2013. As of today, there is no indication he covered anything.
http://ibergamot.blogspot.com/2013/01/positions-market-conditions.html
 http://stockcharts.com/freecharts/candleglance.html?EDZ,EUM,TWM,SMN,faz,sds,qid|B|P5,3,3

Thursday, April 18, 2013

Market Condition

Confidence Indicator (CI) popularized by late great Terry Laundry.He had a whole theory behind how and why it works, tested and researched for many years. The way I use it is simply a ratio of High Yield Bonds overweighted in Technology to Treasuries 15/25 years to maturity. Risk on / risk off so to say. It has an excellent success rate for divergences of this ratio to S&P500 leading to significant downside in Equities,  just like what it has now. Present divergence in price was preceded by internal weakness of indicator itself, as evident by MACD divergence.

 Bunch of other divergences present itself. New High to New Low Ratio gone negative for the first time this year. Less than half of S&P500 stocks are above 50DMA (per $SPXA50R). This is with SPX only about 3% off the highs! Also a deterioration is visible since March
Small caps and Naz100 are weak and leading down. Financials XLF dipped below 50DMA ahead of SPX.
Naz A/D indicator is very weak.

................................................................................................................
 April 19  GOLD Sentiment
40% of newsletter writers recommend shorting Gold - this is most bearish since 2008

April 18   GOLD - Physical demand
           The U.S. Mint in April has sold 153,000 ounces of American Eagle gold coins, the highest in almost three years, after futures prices started the week by plunging the most since 1980.
Sales have more than doubled from March and surged sevenfold from a year earlier, data on the Mint’s website showed. The amount for all of May 2010 was 190,000 ounce.
          This week, retail sales and jewelry demand soared in India, the world’s top gold buyer, and China, the second-biggest, after futures in New York slumped into a bear market, touching the lowest in more than two years. Coin sales also surged in Australia.

April 17 GOLD
CME Hikes Gold, Silver Margins By 18.5%. Only big boys are allowed to play.

April 15, 2013 Monday.  GOLD  falls $150 to low 1335 (close 1361). Half of that drop happened overnight before US market opened.  Volume 657090 cars !!! Highest volume of that day came shortly after open, as gold broke 1400

April 14  GOLD - HFT 


The implication is that HFT bots driving gold down. They are perfectly designed to chew through bid structures, and that's what you see above.  They are 'digesting' all the orders that were still on the books for gold, to remove them so that lower and lower stops could be run.  Charts and explanation are from http://www.peakprosperity.com/blog/81535/gold-slam-massive-wealth-transfer-our-pockets-banks
I had no idea that Gold is liquid enough to handle these machines.

April 12, 2013  Friday.    GOLD  falls $88 to 1501
Goldman Sachs now expects gold to fall to $1,450 an ounce by the end of the year; the company’s original forecast was around $1,810. By the end of 2014, the company believes the precious metal will falter even more, falling to $1,270. Goldman’s 12-month gold outlook also fell from $1,550 to $1,390. Goldman also cut its short-term outlook, cutting its three-month forecast from $1,615 to $1,530 an ounce.

COTTON
 Beijing–through the China Cotton Association–has agreed to extend its stockpiling program of the commodity, and will renew cotton stockpiling from September 2013 to March 2014, with no upper limit on purchases.

...............................................................................................................
I will start to track some of the news. Not because it helps in routine trading. It doesn't. But because markets can't fall without some "shaking of the tree". News cycle has been very quite and benign ever since the beginning of the year, which is unnatural. I strongly believe that some of the news are in fact a "warning shot across the bow", something that changes the balance of things, but often understood only with benefit of hindsight. Still I remember very clearly that I saw right thru all the BS about Jerome Kerviel back in 2008. Kid was softly setup to take a fall for some 500 million in losses for Société Générale (SoGen is a europian equivalent of Goldman Sachs), allowing the bank to get out of massive position in US markets right before Sub-Prime crisis began.
The idea is to plot biggest news on a chart for future use.

In The News:

April 16
Letters containing deadly ricin poison received by Presidents office, some senators and judge. No casualties. Suspect apprehended 2 days later and appears crazy.

April 15 Boston Marathon Bombing. Chechen's involved.

April
        North Korea threatens nuclear attack, severs ties with South Korea. TV is full of cartunish videos of their mid-20th Century army and rockets and that fat kid (Lil Kim). It did get people scared.
        Congress coming back from vacation, get a budget from president that is bigger than before, shots down gun legislation. Starting to shake the news a bit.
        Bitcoin bubble. 40 to 265 in days, than back to less than 80 in hours.
        Japan announces that not only they will print money, but also buy bonds, stocks, ETF's and real estate for next 2 years.
        Numerous announcements of local and other taxes going up. Cost of doing business is thru the roof.

Beginning of April - Bird Flu outbreak in China. Some people died. Human-to-human transmission suspected, but denied by Chinese authorities.

Beginning of March - Cyprus bank crisis. Bank holiday, depositors looted, bailout failed, followed by rumors of their gold reserve sales. Germany approved bailout on April 18

Monday, April 15, 2013

Gold Crash

Below chart from Tiho Brkan shows that gross speculative short positions are at their highest levels in decades. Furthermore, last week public opinion (an amalgamation of a handful of surveys courtesy of sentimentrader.com) reached the lowest level since at least 2004. And bullish percent miners via $BPGDM is at 0 - as it should be in strong downtrend.


 During summer 2008 SLV lost about 50% and October 2008  looked liked no bottom I ever seen.
Infact it looked like Silver goes way down from there. Position in SLV bought anytime during that bear would still be profitable btw.
Fast forward to today.
Buy low - sell high?
This is definitely low (which can become even lower), it just have to slow down...

Specifically, I will not be buying today. All PM's are facing margin liquidation which will happen after 2pm. We had it on Friday, and today futures traders are facing a total loss of their position.

What is going on? I have a theory. For one, if you know that several countries (not hedge funds) may be in position to sell gold in order to repay money they owe to you? Will you help them sell gold at highest prices to somebody else, or at lowest print directly to you?… and blah-blah-blah (add your favorite conspiracy theory).
But really I simply think that this support level was too widely watched, accumulated alot of stoploss orders and now we have a cascading effect. Gold-bugs suffered for too long, capitulating. May last for days-to-weeks, may be over tomorrow

We are looking at transfer of shares from weak hands to strong ones.
Rivers of blood!
Don't get swept away...:-)

Some funny-mentals. Top panel is US based, bottom is Canada. I don't want to touch any South Africa, Peru,etc. All these are profitable! At first glance - I don't see any massive shorts, I do see inst ownership, dividends, low debt and low Price-to-Book on most of these.    HMMM - is an understatement.!

Here is what crazies are up to:
http://www.zerohedge.com/news/2013-04-15/all-eyes-gold-rout-most-oversold-14-years

http://www.tfmetalsreport.com/blog/4643/history-making

http://stockcharts.com/freecharts/candleglance.html?$NYA,$GOLD,abx,gg,nem,au,aem,gold,rgld,fcx|B|P5,3,3
http://stockcharts.com/freecharts/candleglance.html?gld,slv,gdx,gdxj,sil,mux,trx,fnv,exk,mgn,jag,mdw|B|P5,3,3
http://stockcharts.com/freecharts/candleglance.html?SLV,PSLV,SLW,PAAS,CDE,AG,HL,SSRI,SVM,EXK,MVG,GPL|B|P5,3,3


Wednesday, April 10, 2013

March 14 - April 5, 2013

Today is new moon. Sun is active almost non-stop for weeks with some flares.

BOT:
4/4 - MON 106.90
4/2 - SCO 37.14  STOP OUT 36.79
3/28 - NIB 29.55 half pos. Now I have full pos on @ 29.39
3/27 - FB 26.13 Good bullish engulfing bar. Trying for bottom again
3/27 - SCO 37.68 (half pos) STOP OUT 37.10
3/26 - BAL 57.20 half pos. Now I have full pos on @ 56.64
3/21 - SCO 40.19 half pos. EXIT on 3/26 @ 37.45
3/21 - SDS 45.13
3/20 - NIB 28.90 half pos Cocoa as planned here (link)
3/20 - RGLD 68.64 half pos.
3/19 - FB 26.85 STOP OUT 26.28
           FB 26.55  EXIT on 3/20 @ 26.11 What the fuck is going on here?
Devil Degenerate Gambler (DDG) is back. Damn


SLD:
4/3 - TSLA 41.27 Sold half on trailing stop after gap-up
4/1 - JJG 49.20   %loss on half position
3/26 - CCJ 21.12
3/22 - DRYS 2.15 final 1/4 out.  Total profit  % on half position size.
3/21 - DRYS 2.07 (1/4 out) on pop. This one is weak, lucky to be out with small gain.
3/19 - XHB 29.59

Monday, April 8, 2013

Back to Business

I'm back.
Not in terms of being bullish. Not at all.

I was resting for about a month, but in a strange way. I needed a rest, was sick and tired and decided to take it easy in stock-market, especially since entering this "not right" situation. Sometimes its just better to stay away, let the dust settle a bit, let somebody else get chopped-up and wait when there is better risk-to-reward ratio (be it on long or short side). The way this turned out was - I stopped doing my journal entrees, stopped research, but continued to trade, albeit at slower pace and with less that half of account invested. Not surprising, my gains are reduced somewhat. No biggy, but unnecessary. So next time I decide to rest - I will go to cash completely, otherwise it could turn into ugly mess. Therefore, I am back to business.

Positions: about 35% invested
http://stockcharts.com/freecharts/candleglance.html?$CEX,TSLA,BAL,NIB,QID,SDS,FB,MON|B|P5,3,3
 FSCHX 2/3 ; TSLA 1/2
http://stockcharts.com/freecharts/candleglance.html?slv,gdx,sil,fnv,rgld|B|P5,3,3
All  PM and miners are 1/2 position size each.
Also tiny amount in MJNA, PHOT, HEMP all together less than 1/3 pos.

Right now i need to bring this journal up to date, finish all latest posts and  review my positions. Also I was making a list of industries and "General Idea's" - so why not to review each one of them here. Maybe even make some video's