Daily Global Economic Calendar

Real Time Economic Calendar provided by Investing.com.
Showing posts with label In The News. Show all posts

Monday, June 9, 2014

Correct!

After all perturbations of March and April, and getting a brief reset in May due to sickness, I am enjoying a view from the top of rising Bull Wave.

I actually hit AUM low point in early May. Positions I was carrying  in April didn't respond well to earnings. I was stopped out of almost everything with small gains and losses. System 12 was a saving grace, performing much better than in any tests. Luck favors prepared. As I was Digging around (post-link) and reviewing old lists, new scans and my own sanity, I slowly put BCM account back on full margin after being sick in a Box (post-link). Right on time for a late May rip. I haven't made any new purchases in days, sold a couple of things along the way, and now just trailing stops. All positions are in profit, except PPP (-2%). Some met early targets, all have more higher targets ahead... just need to survive a shake-out...
http://stockcharts.com/freecharts/candleglance.html?geo,ppp,sea,fxi,rsx,dhi|B|P5,3,3|0

Last time I looked at SPX prospects was during Fishing Expedition (post-link) in March'14,  correctly analyzed but poorly executed attempt to pick a minor bottom. I wrote:
Fib target ... is 1898. My point-n-figure targets are 1974-1978, followed by 2115 (what?)... Lets first get to 1890, then we will see.
1897.28 happen right on a day of Bloodbath 1% of ATFH (post-link), all part of 50 Day Box (post-link).
I didn't pick the bottom. Fishing Expedition costed me a bit over 10%. Rotation out of prior market leaders, small caps and Bloodbath showed another 10% of losses. Helluva way to start a business, thou kinda typical for me. Every new endeavor of mine always had a rocky beginning.

I made some important changes while Sitting on a Fence (post-link) in late March, ordered myself to Charlie Mike (post-link) in early April, continued Digging (post-link) despite early setbacks, and now I see the fruits of my labor. Correct!

As SPX approaches my initial PF Targets of 1975ish, I astonishingly note that they been adjusted even higher, to well over 2000! In fact the closest target is 2023, followed by 2125ish and 2200 (what? what?!!). There are also Measured Move (MM) targets - one met, another one at 1975 again.
-----------------------------------------

Important observation is low volume on this rally. I heard and read several analysis of how this is a warning sign. True- 70's, 80's and even 90's bull advances where traditionally accompanied by higher volume, illustrating increasing interest and activity. Last 10 years show nothing of a kind. Up markets of late have been characterized by relatively low volume, diminishing every year. High volume days are mostly exhaustion and marks the top. What really happens is summer market started a week before Memorial Day. Volume and activity until 11-12ish, followed by mostly sideways on no volume at-all, and flat overnight. Very low VIX and plenty of shorts to squeeze in most hated bull market in history. How long it lasts? Until it doesn't.

ES expiration is less then 2 weeks away (on 20th). Its very similar to last one (here), in a way of Open Interest (OI) too high at over 3mil cars. Ones again shorts are caught overexposed and running out of time. Fortunately it doesn't matter to me, as I am fully invested and looking to take profits on trailing stops in BCM account. System 9 is a different story, as it holds more positions in diversified portfolio.

-----------------------------------------
There are no important news I am aware of.
-----------------------------------------
Solar activity is very low. Geomagnetic had been quiet for weeks (may be months), until lonely storm couple of days ago.
----------------------------------------
I have a T running out in June, Bradley top date in July, MADI too high for its own good, Golden Indicator still pointing up and no Confidence (via CI) to speak of. I'd like to see this rally run its course and review internal indicators then. Wondering if there is any Astrological thingamabob sometimes soon... Is there such a thing as Bear Market, or is it just an old wife tales?.. Buckwheats...

Sunday, April 6, 2014

What's Up


------------------Internals Update-----------------------
Surprisingly, internals don't offer much insight into presently potentially dangerous situation.
Over 70% of S&P500 stocks are still bullish and above 50dma. It doesn't tell the future, only present conditions.
MADI is still above 0, while Nasdaq A/D indicator is much weaker and already  spent some time below 0 in March. Confidence Indicators are just in a sideways noise. Golden Indicator is surprising - it was advancing strongly in second half of March, I am really curious at what it will do next. SPX under-performing the world and especially Emerging, but it doesn't last long in recent months.
-----------------------------------------------------------

It strongly feels to me that market is falling apart, everything will get hit, leading to much-much lower levels on popular indexes. Small caps (via IWM) and Nasdaq stocks in general are weaker than large caps, represented by Dow and S&P, but I want to focus on S&P500 for several reasons.

I studied major averages going back over 100 years. There is no dependable set of rules that would enable a person to ride every zig and zag. On a top of that they keep changing the rules of how indexes composed and calculated. That cockamamie S&P500 index is calculated based on publicly available float, which is misleading number, and then there is a divisor (o, statistics). Historically index moves up and down 10 to 30 percent at a clip without rhyme or reason, and can go for over 20 years in a wide range without any noticeable progress or just rip endlessly higher for years. We seemed to be in a former up until last year. As I pointed out back in early 2013 (link): "Sure, we can learn from history, but not as much as you think."

There is an unusual divergence in performance of growth VUG vs value VTG stocks, over a recent couple of months. Value out-performance is uncommon, as growth stocks are market leaders most of the time. So much so that 90's crazy bull market was all growth, while value was killed and many good companies in their own mini-bear market, even with averages ripping higher.

Lets assume for a second that miscreants from McGraw Hill are actually doing a good job (for index that is) and that ,based on Dow Paradox (link), "The purposeful manipulation of index components is designed to produce positive outcome, thus creating an upward equity slope". Then it would be possible to find good, profitable, growing companies, that are also in up-trend, among S&P 500 index components. These type of stocks should be something similar to System12 components, as this is how a company becomes one of Mega Dozen (MD) - grow to become The Biggest. The bottom of the barrel should be exactly the opposite - a prime candidate for short before these lagging dullards are dropped from index (and especially after).

OTOH, I am looking for new emerging Theme, not based on my own opinion (which is usually correct, but badly timed), but on price action and fundamentals of present market leaders. The trick is to find a Theme that is emerging from years/months of basing, so I can 'buy low - sell high'; and at the same time the one that is already moving on daily/weekly, so I can 'buy high - sell higher'. This is an epitome of System9.

---------------------------In The News----------------------------
The biggest unreported news is a string of at-least 12 suicides of high level financial services executives around the globe. Tragic and not comical at-all, the story is custom made to fit any popular conspiracy theory. I wonder why nobody seems to step forward?
http://www.zerohedge.com/news/2014-04-05/abn-amro-ex-ceo-found-dead
JP Morgan, Deutsche Bank, Swiss Re, ABN Amro etc. Clean-up or damage control...he-he

Thursday, March 13, 2014

Fishing Expedition

I've been mulling over some philosophical concerns in  "Map is not a territory" post (link) about a month ago.
I ones heard someone comparing market to a puzzle.
A trader works on solving the puzzle, and every time he finds the piece that fits - he receives a prize token with a small monetary value. But I think there is a twist to this story.
You see, when trader goes to sleep... Santa Clause comes and rearranges portion of the puzzle, takes some pieces away and throws in some new ones. His origin is a secret, his reasons are unknown, his logic is moot.
I don't complain. I love the process of solving the puzzle and enjoy them prize tokens. I'm just a little leery of bearded motherfucker... that's all...;-)
Molecool disagreed, as he compared market to hunting:
 You don't care about which way the herd will run. You simply wait for an opportunity to tear into one of the laggards.
Now that is a bit too violent for me, I am too mellow for this kind of metaphor.
I don't even like hunting.
If there is a comparison to animal kingdom, I would go with Leo Cooperman's:
It doesn't matter whether you are a lion or a gazelle; when the sun comes up you'd better be running
Personally, I like to think of stock speculations as fishing...
First of all, fisherman needs a good spot. There is no way of knowing what lurks beneath murky waters - experience and bit of common sense goes a long way in picking a proper location. Preparation matters a lot - gear, bait etc. Gotta go out early ahead of time, to be ready for sunrise. Still, there is no guaranty that fish will bite. All the worms in a world will not help without a bit of luck (try back-testing that... lol).
Patient and skilled fishermen will not go home empty-handed (most of the time).

With that in mind, I embarked on a fishing expedition to pick a minor bottom in SPX via futures (amongst other things).
This is a really weird contract roll, btw. Open interest (OI) is very high still, considering that July will become front month today. It is my own theory, that high OI is indicative of large short position in ES futures. Even after a couple of days of heavy selling, March OI is still over 3mil. How these people are going to cover? They are out of time.
Most surveys show very low or even extreme low in bearishness, which is usually indicative of market top. Usually... After a 5 year bull market one wouldn't expect to find many bears. Not vocal one's, anyway...

I drew a crayon for SPX a month ago, exactly on a day of the bottom here (link), after a 6%ish correction. 1850 high was taken out and will act as support. If the is no overlap, then this market is even stronger that it seems. Fib target from that chart is 1898. My point-n-figure targets are 1974-1978, followed by 2115 (what?)... Lets first get to 1890, then we will see.
I am using System 10, designed just for this condition - a correction in major trend, with entry technique by System 11. Combining the two was a really good idea, as it takes care of major problems for both. System10 often suffered a draw-down, but never had a losing campaign. System11 never had a major loss, but often ends break-even or worse.
Fishing expedition is in progress. Hope I don't fall face in a mud.

UPDATE 3-22-2014:
 Everyone has a plan until they get hit in the face. - Mike Tyson 
Turns out mud was the least of my problems...
Under it was a sharp stone - I got blood and sweat, and mud all over my face
Bruised and humiliated, but not on my back... far from it

------------------------------IN THE NEWS--------------------------------
Ukraine, Crimea, Putin, war, Maidan, pipelines, Black Sea, 15 Billion, corruption...
So much talk, when really its all very simple. Ukraine borrowed 15bil, not its time to repay, but they are broke. Somebody (cough...Putin...cough) will give the money. Somebody ( Ukr government...cough) will steal some of it. Problem is - there is no functional government in Ukraine. Solution - its Jews fault... what else.

Overall - there is no news. Nothing! I don't watch much TV anyway, but things usually get to me somehow. Not lately. So I've been flipping thru channels, and also on a radio, for a couple of days - but there is nothing!. Little bit here and there, but mainly we don't have economy, politics, foreign affairs, scandals, scams, crimes or unemployment.
We have pleasant, giggling, mindless stories about nothing

Saturday, February 15, 2014

System 12 2-2014


 ------------------Internals Update--------------------
Its safe to assume that T12/2013 from this post (link) was blown out by new low on T-Theory Volume Oscillator. It went below -80, way lower than T12/2013 low, and recovered sharply - classic bottoming behavior. There was no positive divergence at bottom, so retest within 2 months is possible.
Interesting that new VOT2/2014 points to mid June 2014, just like VOT6/2013 I plotted back in December!
Spooky...
VO T 2/2014


System 12 BCM:
http://stockcharts.com/freecharts/candleglance.html?WFC,RDS/B,NVS,MSFT,GOOG,PFE,JPM,JNJ,brk/b,ibm,ge|B|P5,3,3
MD Control dipped almost 6% from beginning of year, and still under-water as of 2/15/2014.
S12BCM started 1/28/2014, was down negligibly. Presently positive and accumulating.
(UPDATE: added JNJ on 2/20; BRK/B on 2/25; IBM on 2/27; GE on 3/6; BHP stopped out)
BHP, VOD, BAC, T

This is MD:
http://stockcharts.com/freecharts/candleglance.html?AAPL,XOM,GOOG,MSFT,PTR,BRK/B,GE,JNJ,WMT,WFC,RDS/B,PG|B|P5,3,3

MD Control: CVX replaced with PG
I have:  GOOG, MSFT, WFC, RDS/B
PTR still disqualified.
RDS  not sure when earnings. Year end in Dec., results published in March?
BRK annual report in Feb-March?
WMT 2/20b

This is SD:
http://stockcharts.com/freecharts/candleglance.html?JPM,CVX,HSBC,PFE,NVS,IBM,CHL,TM,BHP,VOD,BAC,T|B|P5,3,3
I have: JPM, NVS, PFE
HSBC annual report in Feb?

Shopping list:
http://stockcharts.com/freecharts/candleglance.html?AAPL,XOM,BRK/B,GE,JNJ,WMT,PG,hsbc,ibm,bhp,vod,bac|B|P5,3,3

UPDATE  2/22/2014
For  research purposes, I wanted to see optimized Daily MA's for System12 stocks. If 50/200 don't fit well, then 25, 80 and 100 seem to provide better signals. 100ma work for major multi-months trend continuation. 25ma work for early exit after multi-weeks uninterrupted advance. These results are preliminary, and require further testing. Still I don't have an answer on how to sidestep multi-month sideways chop. I guess it all depends on market conditions and what is available from MD and SD - meaning : if no better opportunities are offered, then its better to sit sideways and collect a dividend. I painted myself in a corner here...
http://stockcharts.com/h-sc/ui?s=$SPX&p=D&yr=2&mn=0&dy=0&id=p82691261269

-------------------------------IN THE NEWS---------------------------
I already heard several times about companies that shoot new, smaller and faster satellites into space to provide photo and video images of Earth. Skybox and Planet Lab are all the talk, took 100mil of investments, but not public. There is DGI (+400% in 2 years), Orbital Sciences ORB (+200%) and bunch of others, not forgetting about Elon Musk's space rockets.
 "Starship Enterprise" (lol) will be the name of this theme.
http://www.spacenews.com/

Coffee is diseased with 'rust' - OMG!  TV says rust to blame for high coffee prices... Am I mad?...wasn't coffee in bear market for few years? I can't explain, but was looking at the situation for a while.

Peace talk with Syria broke down again... what are they negotiating...?

Wednesday, February 5, 2014

My A/D Indicator and Internals Update

Over past few days I stopped out of almost all common stock holdings, except gold, silver, miners, pot (in LB account), utilities and couple of other things. I don't have any shorts on. System 9 is over 50% cash, account continuously pushing new equity highs. System11 had  a streak of winning trades, even thou I trade it sporadically and missed most of good opportunities. System12 stalled (as it should in correction) with only 4 positions so far.
I am crazy busy at work, as my departure nears. Already started to train my replacement - she is very bright - hope she doesn't quit before I leave...lol

I will be cashing out most of marijuana stocks from Z account, in order to pay for Boichik trip to Italy next year. Only a few months ago it seemed absolutely impossible. This is a great news, and a major achievement for me - to make and withdraw a significant amount of money from the market!
I feel very proud. Remember Ibiza - The Impossible Dream... Will happen someday too...

-------------------------------------------------------------------------

I started to get ideas about how to use My A/D Indicator (MADI) about a year ago in this Internals Study (link). Since then I added and changed  few things. First of all, I now mostly use NYSE Advace/Decline issues (NYAD), because it seems to produce cleaner signals, but still look to Nasdaq (NAAD) for confirmation. Sometimes they diverge - I don't know what it means.

This is what now are MADI Rules for Bull Market ( I suspect that bear market will produce different levels, but don't have data to test):

- When 20ema is under 0 - market is consolidating or falling. Bottom will be made before 20ema recovers above 0.
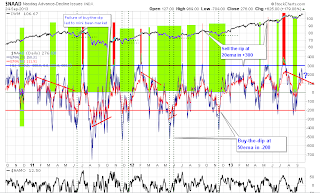
- When NYAD 20ema goes below -200, and doesn't recover quickly, - it will go lower and produce at-least a tradable bottom at much lower levels. Most common next level is -400 to -600. Note that August 2011 bottom was -900 on 20ema! This spike lower will get a retest most of the time.
- When NYAD 50ema goes to or below -200, then its a Just Buy The Fucking Dip (JBTFD). This seems to be the most reliable use of MADI.  Buyable dip happens couple of times every year, usually followed by second dip of indicator 2 weeks to 2 months after extreme reading of -200 (or less) on 50ema of Advance/Decline issues. Failure of this bottom may lead to mini-crash (this is what happened in 2011)
- In order for bottom to be complete 20ema has to rally fast and recover above 0.
- In a bull market, MADI will spend more time above 0, allowing to keep positions longer and add on dips.
- "Sell The Rip" is generally at NYAD 20ema +400, but can go to +600/+700. As it is, its not a good signal to short the market - several of these high readings where just run over in early 2013. I'd say - when indicator is that high, probably too late to buy.

MADI 2/2014
3 year study of MADI is here (link)
----------------------------------------------------------
T-Theory Volume Oscillator checked at -80, the reading usually associated with tradable bottom. It may be already double bottomed. Unfortunately it may have destroyed T12/2013 (from this post link). I will wait for a rally, to see if market really bottomed, and revisit T-Theory then.

Confidence Indicator dumped, treasuries are a place to be since the beginning of the year, investment grade corporate bonds are better than high yield junk (no shit).
Golden Indicator warning that shocks are weak, although S&P and developed markets are stronger than Emerging.

-----------------------------------------------------------
http://www.zerohedge.com/news/2014-02-04/marc-faber-fears-vicious-circle-downside-just-beginning
Mark Faber warning again. Treasuries are the place to be for next 3-6 months. I already have VUSTX in System 1 account, not looking to add for now.
-----------------------------------------------------------
 Nadeem_Walayat see ..."No sign whatsoever that this  bull market is anywhere near being over!"
 "THIS stocks stealth bull market is one of the GREATEST bull markets in HISTORY!"
"The current stock market correction looks set to attempt to revisit 15,000. How close it gets to 15,000 I can't tell, perhaps half way, just that the correction is not done to the downside."
His favorite sector is Biotech, and has been forawhile.
http://www.marketoracle.co.uk/Article44238.html
-----------------------------------------------------------
http://www.zerohedge.com/contributed/2014-01-23/roubini-many-davos-speakers-think-it%E2%80%99s-1914-%E2%80%A6-right-ww1-broke-out
Classic ZeroHedge. The world is ending...again...any day now...
------------------------------------------------------------

Weekly Nasdaq A/D Cumulative
http://stockcharts.com/h-sc/ui?s=$NAAD&p=W&yr=3&mn=0&dy=0&id=p03531550066
My A/D Indicator (NYSE) with BPSPX and SPXA50R
http://stockcharts.com/h-sc/ui?s=$NYAD&p=D&yr=2&mn=0&dy=0&id=p24055471029
McClellan Suite: NYMO; NYSI; NAMO
http://stockcharts.com/h-sc/ui?s=$NYMO&p=D&yr=1&mn=0&dy=0&id=p04197492070
T-Theory Volume Oscillator
http://stockcharts.com/h-sc/ui?s=$NYUD&p=D&yr=1&mn=0&dy=0&id=p81565637438
Risk-on /Risk-off ratios, aka Confidence indicator (FAGIX:VUSTX;  HYG:LQD;  $SPX:$USB)
http://stockcharts.com/h-sc/ui?s=FAGIX:VUSTX&p=D&yr=1&mn=0&dy=0&id=p43022938657
Golden Indicator with World Ratios
http://stockcharts.com/h-sc/ui?s=$SPX:$GOLD&p=D&yr=1&mn=0&dy=0&id=p51708175586
----------------------------------------------------------
http://ibergamot.blogspot.com/2013/12/new-t-and-internals-update.html
http://ibergamot.blogspot.com/2013/09/internal-indicators.html
http://ibergamot.blogspot.com/2013/04/internals-study.html

------------------------------ In The News ----------------------------
Solar activity is productive with M-class flares every day. "Solar activity is expected to be at moderate levels with a chance for high levels through 09 February", sais NOAA.

Now we have a new Fed Chairman(woman). Bermonkey is no more. Good riddance.

Emerging markets are submerging again. Turkey, Argentine, Brasil, South Africa, bunch in Asia, etc are in some kind of currency crisis. China got banking problems. I am looking to buy the blood.
Here is very smart India central bank Governor Raghuram Rajan talks  about interest rates, fund outflows, the rupee and global monetary policy coordination on Jan 30.

-------------------------------------------------------------------------


Sunday, January 26, 2014

Short Commodities Short

Some of my biggest losses in 2013 where stocks index shorts. While operating in non-margin LB account, only way to short is thru leveraged short etf's - and they carry their own set of practical problems. Never mind the futility of attempts to short S&P 500 during roaring bull market, I am talking about decay of leveraged etf's. I experienced it first hand in SDS, which suppose to be the most efficient and liquid vehicle to short major index, but was decaying by a full percentage point per month. Now , equipped with (almost) full power BCM account, I can try to use it to my advantage.

While reviewing Commodity Index etf's in  Real Stuff post (link), I was noticing how lousy this way is for investing into commodities. Not only all of them are at-least second derivative on underlying futures, options or some kind of swaps, but they are poorly managed. I don't know any people involved, and may be they are actually doing a good job, may be this is as good as it can be... I want to believe in responsible, smart people, performing their fiduciary duty... Somehow their customers are at constant disadvantage, suffering decay and high costs, and continuously under-performing corresponding index. All this is Commodities Index Long.

Take all problems of long commodity etf, flip it on its head, add leverage, wild futures swings and inefficient options market, multiply by illiquid equity etf market, raise to power of Wall Street sociopaths - and bingo - formula for leveraged short commodities etf's. This must be a disaster of tremendous size, and looking at how many of them closed down last year - the 2nd year of major BEAR market in commodities !- they know there is a problem. THEY always know, I'm just following the bread crumbs.

The way to use this dilemma to my advantage is to  Short Commodities Short, but carefully. It requires for commodities to at-least not fall, they really don't even have to rally big - decay is on my side.

There is only one commodity index short - DDP; whole bunch of energy double and triple short etf's (as it should be - oil and gas are the biggest component of any commodity index); closely followed by gold and silver. Specifically PM inverse etf's are very liquid with active volume pattern - must be real popular these days... he-he

http://stockcharts.com/freecharts/candleglance.html?DDP,AGA,BOM,ERY,DNO,DTO,SZO,SCO,DWTI,DGAZ,KOLD,GASX|B|P5,3,3
http://stockcharts.com/freecharts/candleglance.html?DZZ,DGZ,DGLD,GLL,ZSL,dslv,DUST|B|P5,3,3

I don't have any short interest info on these, but Finviz study reveals monster volatility on weekly time frame. Not a  single one would be considered by System 12, in fact its an exact inverse of every rule of System 12.
 These following charts are the real world results of this atrocity.
So what did you trade during 2-year long commodity bear-market?
That -95% disgrace is ERY - Direxion  Energy 3x Bear
Gold and Silver shorts are a definition of  'monkey hammer', especially DSLV - now that looks almost criminal!

--------------------------------------------------------------------------------
 "He who fights with monsters should look to it that he himself does not become a monster. And when you gaze long into an abyss the abyss also gazes into you." - Friedrich Nietzsche
-------------------------------------------------------------------------------

UPDATE 2/3/2014
Well, unfortunately things don't always work out in real world, and sometimes not even due to my own error. Specifically, this excellent notion of shorting leveraged inverse commodity etf's -
a complete fucking scam.

First of all, these shares are not readily available for short sale at my brokerage OptionsXpress. I understand the mechanics of short sale and , yes, its possible for any security (even actively traded) to be 'hard to borrow'. An option to call a representative was a way to go. I did. Surprise! There are some shares available, not for all symbols, not many, not all the time, in odd amounts, but available nevertheless. So I shorted whatever I could get - I didn't need too much, because of my position size rules. All is well in BCM land...

Then on Friday 1/31/2014 - boom! - all my short shares covered by brokers order (cough...Amy...cough), because they are no longer available... WTF, you know...?  I send an angry e-mail, but not expecting much. Brokers can do whatever they want. I should be looking for new broker, or just go back to Interactive Brokers (shit, I don't like so many things about them), which will make me re-start System 12 again. Again?! OMFG!

Obviously, I am pulling this theme. Its a good, practical idea... oh, screw that - its a fucking brilliant idea!..., but its not robust, and prone to failure thru no fault of my own.
I know 'when to fold 'em'...

-------------------------------------IN THE NEWS-------------------------
Obammer announced "My RA" during State of the Union Address.
http://finance.yahoo.com/news/obama-launch-government-backed-retirement-110000794.html

MyRA will be like Roth IRA, but with holdings backed by the U.S. government like savings bonds.
A-HA - this is where QE bonds going to go! Will be sold back to muppets! Un-fucking-believable!
Sounds like a great set-up: 15K maximum contribution for 30 years, earning variable rate (that's your Treasury Bonds), practically no minimum contribution limit, and (because its after-tax money) contribution can be withdraw at any time tax-free (didn't I already said that?). Yep, its all tax-free after taxes paid, except for gains that are taxable again.
If family makes more that 191K a year, they can not play.
 "MyRA guarantees a decent return with no risk of losing what you put in," President Barack Obama said
Oh, I was worried there for a second...
-------------------------------------------------------------------
http://www.zerohedge.com/news/2014-01-28/marc-faber-warns-insiders-are-selling-crazy-short-us-stocks-buy-treasuries-gold
-------------------------------------------------------------------


You Are Mine

Wednesday, November 6, 2013

Twiter IPO

Finally, this day has come!
Actually its getting 'priced' today, but will start trading tomorrow.


-----------------------------------------------------------------

IPO market is super hot. Companies coming in droves, with no revenues or profits, and surely double on a day of IPO. If I was ever looking for an event that could mark the top of this bull market... TWTR would do. What top? This is the 4th biggest bull market in modern history. Tulips, yep

Since before Gov shutdown, I am having a hard time catching any data releases. There is very little discussion on Bloomberg and NPR. Admittedly, I watch even less news than before, but not completely cut out, so something should have gotten to me. OTOH, ZH featuring articles about major misses and deterioration of all kinds of economic data, or at-least parts of it.

btw, I am reading ZeroHedge on purpose. There is no other website I know of, that offers real important news fast, plus analysis of economy and financial markets in real time. The only drawback is that Tyler offers it with a bit more hysteria than I would prefer, and with definite perma-bear bias that I share at this time (never mind that more than half of my portfolio is long at this time).

From ZH: here are dates of tops and bottoms of all bull and bear markets from 1929
Field of research is narrowing. Air is really thin up here
this the fourth biggest bull market in US history
http://www.zerohedge.com/news/2013-11-04/4616-sp-feds-ultimate-goal

--------------------------------------------------------------------------------
There is going to be a 'scheduled' electric grid shut-down on November 13-14 to test US/Canada electric grid. info is very scarce, mostly rumors.
11-13-13 Another date too easy to remember (like 9/11, 7/7 etc)?
Also it seems too easy to make parallels to other false-flag events of recent past and how gov ... and bla-bla-bla
I asked an opinion of RedDragonLeo - a major doomsday expert, numerologist, Legatus watcher etc. Guy is very skilled and called in advance every major top over past couple of years, except none of that ever worked. So much so, he had to resort to penny stock pushing/pumping... very sad.
Red replied here: http://reddragonleo.com/2013/09/28/the-stage-is-being-set-for-a-possible-3000-point-drop-in-the-dow/#disqus_thread  
Here is an excerpt:
"I heard about that electric grid shutdown too but so far ever last thing predicted since about 2009 forward never happened. We all got scared with Planet Nibriu, Mayan Prophecy of "the end" in 2012, and dozens of other scary forecasts... but none of them happened.  I don't think this one will either...
 ...While a pullback is still likely to happen I'm starting to think that they are going to rally this up much higher then we believe possible next year, and maybe the year after that too? While you can't trade off what Lindsey Williams says I do believe his statement that the elite aren't done creating enough debt yet...
... The next meeting is Feb 6th-8th, 2014 but until we top 2000 SPX I wouldn't even think for a minute that the "real crash" is coming...."

 Like I said, Bears are Extinct.

------------------------------------------------------------------------


I don't think i mentioned it before in this journal, but there seems to be an almost a determined effort to destroy financial industry. Knight, PFG, MF Global, SAC etc are gone; and numerous cut backs of trading desks across financial instruments. Not to mention S&P Chicago pit, now almost deserted.

Banks aren't helping themselves either, as widespread market manipulation scandals come to light.
Here is Matt Taibbi of Rolling Stones:
 "The only problem is that the scale of the misdeeds in these various markets is so enormous that even the most half-assed attempt at regulation will cause a million-car pileup...If they're guilty, they're done."
http://www.rollingstone.com/politics/blogs/taibblog/chase-isnt-the-only-bank-in-trouble-20131105

-------------------------------------------------------------

This is how this shit really works these days. The real pro's of Wall Street, the modern day market makers, 'specialists' - algorithm builders. Complex system of markets is more complex than ever.
http://youtu.be/GEAGdwHXfLQ


http://www.zerohedge.com/news/2013-11-04/exposing-wall-streets-hidden-code

-----------------------------------------------------------------------------------

ECRI's Lakshman Achuthan on Bloomberg
"we believe a US recession began in 2012"
 

Monday, October 14, 2013

Third Week of Gov Shutdown

Government is really not completely shot down. ZH said that 83% still operational. State and local are working, but still... Treasury will run out of money this week. It happened before and always resolved itself.
“Many people want the government to protect the consumer. A much more urgent problem is to protect the consumer from the government.”
~ Milton Friedman
Positions:   Almost 30% cash
http://stockcharts.com/freecharts/candleglance.html?SLV,GDX,SIL,FNV,RGLD,TRX,PPP,AG,SLW,PGH,AMLP,SCO|B|P5,3,3
http://stockcharts.com/freecharts/candleglance.html?$CEX,SDS,SRS,SKF,DVA,NM,KEX,TSCO,HRL|B|P5,3,3

Entire Precious Metal (PM) portfolio is under water, with TRX, SIL, RGLD, GDX down 25%+. This PM trade is failing and, barring a miracle recovery, will have to be liquidated.

Watch list :
http://stockcharts.com/freecharts/candleglance.html?TBT,JJG,TSCO,DDD,SSYS,IGE,JJC,PALL,ccj,TSLA,FB,SCTY|B|P5,3,3
TSLA and FB no re-entry. Info only

http://www.valuewalk.com/2013/10/jim-chanos-wsj-conference-full-speech-video/
Jim Chanos of Kynikos Associates.Talks about China, how hard to be a short seller (yea, no shit). "...its a celebrity market - its who is buying a stock , not why..."  MLP and REIT's

Wednesday, September 25, 2013

Internal Indicators

Being completely lost, as far as market direction is concerned, and invested at 50% - I want to review some key market indicators.


http://stockcharts.com/h-sc/ui?s=$NAAD&p=D&yr=0&mn=6&dy=0&id=p44764799133
http://stockcharts.com/h-sc/ui?s=$NAAD&p=D&yr=3&mn=0&dy=0&id=p74347576066
http://stockcharts.com/h-sc/ui?s=$NYAD&p=D&yr=1&mn=0&dy=0&id=p39294453226

http://stockcharts.com/h-sc/ui?s=$NYMO&p=D&yr=1&mn=0&dy=0&id=p04197492070
http://stockcharts.com/h-sc/ui?s=$NYMO&p=D&yr=1&mn=0&dy=0&id=p89369245088


http://stockcharts.com/h-sc/ui?s=$NYUD&p=D&yr=1&mn=0&dy=0&id=p81565637438
Volume Oscillator T's continue to be unreliable in 2013. T4 and T6 missed the tops, and T8 is doing something wacky. Admittedly,  I couldn't recognize T8 bottom as it happened.
VO T April-September 2013
 Risk-on /Risk-off ratios, aka Confidence indicator (FAGIX:VUSTX  LQD:HYG $SPX:$USB)
http://stockcharts.com/h-sc/ui?s=FAGIX:VUSTX&p=D&yr=1&mn=0&dy=0&id=p69808339952
http://stockcharts.com/h-sc/ui?s=FAGIX:VUSTX&p=D&yr=1&mn=0&dy=0&id=p02920481296


http://stockcharts.com/h-sc/ui?s=$SPX:$GOLD&p=D&yr=3&mn=0&dy=0&id=p51275941041

$SUPADP   $SUPUDP      S&P 1500 is a great index for breadth indicators because it combines the S&P 500, the S&P Midcap 400 and the S&P SmallCap 600

Here is a new idea (UPDATE 12/15/2013)
 $SPX:$GOLD used not as a ratio, but as SPX priced in Gold, aka Bullshit Indicator.
If its rising - all is good in the land of stocks.
If its falling - stocks are Bullshit!
also trying to look at following ratios without referring to S&P (plot not included in this study)
$SPX:EFA   $SPX:EEM   EFA:EEM seems to produce at-least 2-3 months trends
It is not necessary to invest in under-performing areas of the World
http://stockcharts.com/h-sc/ui?s=$SPX:$GOLD&p=D&yr=1&mn=0&dy=0&id=p51708175586

http://ibergamot.blogspot.com/2013/04/internals-study.html

MATRIX 
Daily  http://stockcharts.com/h-sc/ui?s=$SPX&p=D&yr=0&mn=6&dy=0&id=p71533435672
Weekly   http://stockcharts.com/h-sc/ui?s=$SPX&p=W&yr=3&mn=0&dy=0&id=p41109488212
Volume Profile  http://stockcharts.com/h-sc/ui?s=$SPX&p=D&yr=0&mn=9&dy=0&id=p89183620435


...................In The News..........................
All about gov. shutdown and debt ceiling. General opinion is that its much ado about nothing. They shut government down before, causing some turbulence, but then market quickly recovered. Debt ceiling debacle caused August 2011 collapse. I remember it well - debt-ceiling was lifted at the last moment, but market crashed anyway. So basically we are conditioned for a 'recovery' after....hold on, after what?

Here is ConvictScott:  (from here http://evilspeculator.com/?p=38564)
 Given that we have the money honeys and affiliated news clowns yabbering about the gubmint shutdown, the odds favor uncertainty with a strong chance of an epic short squeeze.
Just the same fucking circus as September 18 "No Taper" announcement. Everybody kinda agreed that 10-15bil taper of fed purchases would probably be good, and thats what fed was talking about all this time. I don't think they know what to do. I think there is a problem we are not aware of. Why? Market topped on that announcement, with general consensus that softness is temporary and recovery after... is most assured.

We have been going thru this nonsense for few years now. I am not sure if its always been like this. I can't learn all I need from history. My problem is that I have been investing during period after 2000, and don't have my own experience of secular bull market. Was it like this? An endless climb of wall of worry?


Sunday, August 18, 2013

Big Data and Cloud

Why am I so scared? A reflection of social mood or contrarian stance?
The weakest link - information, communication, cell phone and internet. There are redundancies, protection and back-up, but will it be enough? A small earthquake (about a year or two ago) - and everybody was lost, no phone, no plan... one can steal a City-Hall and nobody will notice until sometime later.

They think a stop-loss order will work. If you can put it in, if broker will receive it, if market functions properly and with liquidity enough to accommodate... Many if's

I hear a lot of stories about hackers and internet attacks. I hear stories about Big Data mining and spying. I hear that Cloud Computing will change the way we live and work on internet. I am asking a lot of question, I am asking computer programmers and users, I read, I research. I have NOT heard a meaningful and coherent explanation about how all this shit really works together. If the only people who should know, really don't - what about the rest of us?

There is a ISE Cloud Computing Index Fund - SKYY - its top 10 holdings (almost a half of assets) change quite a bit from month to month, plus they rebalance semi-annually. Expense ratio is 0.6%. Started trading in Summer 2011, it recently broke all time highs with strong Volume Profile (VP).

Cyber Security
https://www.motifinvesting.com/motifs/cyber-security1#/overview
 http://www.marketoracle.co.uk/Article41538.html
http://www.finviz.com/screener.ashx?v=111&f=ind_securitysoftwareservices&o=-marketcap

----------UPDATE 2/16/2014------------------
http://ibankcoin.com/flyblog/2014/02/16/the-next-super-trend-is-here/#comments
http://stockcharts.com/freecharts/candleglance.html?FEYE,CUDA,IMPV,SPLK,DATA,SWI,GIMO,PANW,BLOX,DWRE,sale,crto|B|P5,3,3
--------------------------------------------------
            UPDATE UPDATE 4/9/2014
Less than 2 months later all Fly's picks from above look pretty pump-n-dumpish...


..............................................In the News.............................................
Less than 2 weeks after this post Nasdaq main computer broke down for 3 hours. As soon as it came back, NYSE computer froze. The following day Eurex Exchange broke down for over an hour. "Technical issues" are the reason. Yea, no shit. Trading was disrupted for some securities, and I actually had some of them, and I couldn't put the sell-stop order in. All this when volume was very low and many are still on summer vacation, plus Sell Rosh Hashanna on September 5. So the question from above post: "If you can put your stop order in?.. The answer is : NO!

Other than that, its all Sirya. We are not going in without UN resolution, which Russia and China promised to veto, except they walked out from meeting where voting was suppose to happen. Politics - show business for ugly people.

Tuesday, June 25, 2013

Ci Sara

History doesn't repeat, but it rhymes....somebody said.
The reason why I am fixated a bit on this kind of top is because of a treacherous nature of it. How fast a pullback of a strong bull market turns into failure. Look at it - only few days to sell, before "window is the only way out". If you don't have discipline, if you don't have a plan - you don't stand a chance.
OTOH some tops take time to distribute, to chop for months, like 1999-2000, following slow drift down. This will give people some time, although outcome is the same - it will not be so dramatic for participant's psychology.
I believe this is fractal, and observed on multiple time-frames.
http://evilspeculator.com/?p=36635
1987
2013
  I remember summer 2011, like it was yesterday. 40 down, then another 60 down reversing and painting hammer, then 80 down. I lost it. Terror...
I learned alot about myself then, using these lessons now (I think)

 Just looking at all asset classes (except Dollar) go down together, I had a scary thought:
Can you imagine a bear market like this, with no place to hide, lasting for months and months?
Don't think its impossible

Positions:
http://stockcharts.com/freecharts/candleglance.html?SLV,GDX,SIL,FNV,RGLD,TRX,NM,TK,TBT|B|P5,3,3
http://stockcharts.com/freecharts/candleglance.html?$CEX,NIB,JJG,SDS,QID,SRS,EWJ,CCJ,TSCO,ZSL|B|P5,3,3
FSCHX(CEX) 2/3pos;   NM, SLV, TRX, SIL, RGLD half-pos

Main1
http://stockcharts.com/freecharts/candleglance.html?$NYA,$SPX,$COMPQ,QQQ,IWM,EFA,EEM,$TNX,UUP,GLD,USO,GCC|B|P5,3,3
S&P Sectors+
http://stockcharts.com/freecharts/candleglance.html?SPY,XLF,XLK,XLI,XLB,XLE,XLP,XLV,XLU,XLY,ibb,gdx|B|P5,3,3

Watch list:
http://stockcharts.com/freecharts/candleglance.html?TSLA,PGH,XHB,XLK,FB,DDD,YELP,ANGI,GSVC,ULTI,tan,scty|B|P5,3,3
http://stockcharts.com/freecharts/candleglance.html?PALL,GOLD,PPP,LODE,Bal,GAGA,ANFI,LNN,MON,sea,tnk,stng|B|P5,3,3
http://stockcharts.com/freecharts/candleglance.html?SEA,kex,tgp,too,TDW,CKH,SSW,MATX,STNG,DRYS,DSX,ckh|B|P5,3,3
http://stockcharts.com/freecharts/candleglance.html?MDBX,CBIS,MJNA,HEMP,PHOT,AVTC,TRTC,ERBB,SRER,GRNH|B|P5,3,3

While everything is oversold together on daily time-frame, I remember the same right before 2011 summer crash. Assuming there is a bounce, SPX is sitting right on 100dma and 20wma with bunch of support levels below, but 1610-1620SPX needs to be taken first. How long will it take, will it be enough - remains to be seen, but TTheory Vol Osc and My A/D Indicator made lower lows and both remain in bear market territory, Volume Profile deteriorated as expected, and I have 3ptPF Target of 1470SPX.
Bradley Turn Date is 6/22, full moon 6/23, solar activity is on a rise again.

................................IN THE NEWS.....................

Its like this: economic news are all good or better than good, and seems to indicate continuing growth in USA and not in China. All other news are all negative and there are alot of them. Looks like they dig out every piece of nasty news, even dust off some old ones, so whatever your preference is - there is a negative story to worry about. This all nonsense of-course and I am trying to stay away from madness, besides I don't see anything critically important at the moment. It is customary for a big crisis to present itself after markets collapse somewhat, unfortunately profit opportunities are limited by the time reasons are known.


Ci sara’ - una storia d'amore e un mondo migliore.
Ci sara' - un azzurro piu' intenso e un cielo piu' immenso.
Ci sara' - la tua ombra al mio fianco vestita di bianco.
Ci sara' - anche un modo piu' umano per dirsi ti amo di piu'.


 There will be – a love story and a better world
There will be – sky-blue more intense and a sky more immense
There will be – your shadow by my side dressed in white
There will be – also a world more human for to say I love you the most

Friday, June 21, 2013

Op Ex Day

Yesterday I noted here http://evilspeculator.com/?p=36635#disqus_thread
 Everything is down together (stocks, bonds, silver, oil)
No place to hide
Year of Cicadas...lol

All my A/D indicators are at "last stand" line.
In recent past it led to hard V-type reversal.
If fails, SPX will have a 14xx handle by Monday

BOT:
6/19 - SRS 21.34  Double-short Real Estate (IYR)
I tried to short RE before, but it was too strong and stopped me out. May 22 was the top, and it went straight down without giving me an entry until today - on reaction to 20dma, double inside day breakdown and sto cross. Considering how far and fast it fallen, I can't figure out the target and will play it day-by-day.
6/20 - QID 23.51 After a fake-our breakout, when I stopped out only 2 days ago, this double-short QQQ is back on. Watching 72QQQ area for reaction.

SLD:
6/20 - XHB 29.54
6/20 - TSLA - 101.80   Tesla was holding fine until today. Poor price action midday. Exit. I need to stay away from TSLA forawhile.
6/20 - PGH 4.82 On stop. Looking for reentry.
6/20 - FB 23.83  For few months I  see accumulation in intraday price action, and expecting bottom to be made, but may be at lower levels still. 24-25 is strong resistance area, also where 200dma is.
6/21 - XLK 30.53

...........................................IN THE NEWS......................................
Obama fires Bernanke on live TV on Charlie Rose program.
Riots in Turkey and Brazil - something about benefits, economy etc. not sure
China's interest rates explode, they doing cash injection into some banks.
Obama and Putin where suppose to have disarmament talks, its seems to fell thru. I guess nuke recycling agreement is a toast. Can't find any info anywhere. Maybe there is hope for uranium industry, represented by CCJ.

Wednesday, April 24, 2013

Full Moon

Full Moon, Lunar eclipse, solar is active non-stop every day.  All we need is a juicy news story.

SLD:
4/25 - SRS 18.60.    (   % loss on Half pos)
4/25 - IMAX 25.95 on earnings. No so much as earnings are bad (I am actually not sure), but it is definitely not a LVM. LowVolatilityMover does't go 4% down and 3% up within one day. Chart is still not bad, I will review it next week. I sold at the top of support zone for   (   % loss on Half pos), so far its still low of the day (2:06pm est), volume is very high.
4/25 - SCTY 23.87 This thing is up almost 20%. Selling 1/4 pos on close stop. Still have 1/4pos on.

I will be out of office tomorrow on 26th. Do i set close or far stops?

April 25, 2013
TSCO earnings. Initial sell off sharply reversed. I need to look into what are they doing right.

HDGE is getting killed, many their top holdings reversing sharply to upside. Hopefully its just a short squeeze. I will give them more time, but not much more.
http://stockcharts.com/freecharts/candleglance.html?HDGE,DB,TCK,GT,CBT,PVH,FDS,CTL,CMA,FFIV,FITB|B|P5,3,3
HDGE UPDATE 4/29/2013. Top holdings. Added FOSL, COH;  dropped FFIV
http://stockcharts.com/freecharts/candleglance.html?HDGE,TCK,GT,CBT,CTL,DB,FDS,CMA,FITB,FOSL,COH,pvh|B|P5,3,3

In the News:

April 24, 2013  -  CYBER ATTACKS
“On April 23rd, Schwab was one of the most recent targets of a “denial-of-service” attack perpetrated by a third party. ... Based on the history of denial-of-service attacks on other companies, we anticipate these attacks may continue against our industry – and us – for some time."
Also on 4/25 many complained about slow internet connection, misquoted charts and some kind of problems with quotes at CME/CBOE.  My price watch list at OX (Schwab) is acting up all day long, but i did not receive any messages. My Streaming Charts are fine, orders where executed without problem.


Deutsche Bank Downgrades Gold Miners     
 Deutsche Bank Markets Research downgraded three stocks, cutting Barrick Gold (ABX) and Kinross Gold (KGC) to Hold from Buy, and lowering their rating for Newmont Mining (NEM) to Sell from Hold. They kept Goldcorp (GG) as a Hold.
 Under a $1,500/oz gold price scenario we believe NA Gold producers equity values become “scissored” between a sharply lower-than-expected gold price and still rising capex commitments/ operating costs/ cresting resource nationalism, leading to large potential shareholder dilution in 2H13. Under $1,500/oz gold price scenario, net present values decline by 21%, with larger drops to prior NPVs seen at Kinross and Newmont (given relative higher cost operations). Under an extreme $1,300/oz gold scenario NPVs fall 78%…

 Barron's Big Money Poll is crazy bullish
74% of money managers identify themselves as bullish or very bullish about the prospects for U.S. stocks -- an all-time high for Big Money, going back more than 20 years. What's more, about a third of managers expect the Dow Jones industrials to scale the 16,000 level by the middle of next year

Monday, April 22, 2013

Positions, Bergamot T Out

Conservative Bergamot T run out in beginning of April.I arranged these center-posts back in January in this post (link).
Conservative T is anchored into violent V-shaped November bottom, and proved correct. Now the remaining questions are: will this be a double top with  higher or lower low, or some kind of "Null Echo" effect, or may be longer T into summer is not correct at-all. There where questions about validity of December center-post, because Nov 15 and Dec 28 bottoms are too far apart.
That aside, I consider this Bergamot T project a success. It guided me just fine since beginning of the year and I am looking forward to doing this again sometimes in future.

BOT:
4/9 - TRX 3.62 1/4pos
4/12 - HDGE 17.45 Half pos
4/18 - TSCO 105.79
4/18 - TRX 2.60 1/4pos
4/18 - SRS 19.65 Half pos
4/18 - SCTY 20.18 Half pos
4/18 - IMAX 27.74 Half pos
4/18 - HDGE 18.29 Half pos

Dividends received 4/12-4/19: CCJ, RGLD, Chemical Mut fund: $49.42 (whoopty doo)

Positions:
http://stockcharts.com/freecharts/candleglance.html?$CEX,TSLA,BAL,NIB,QID,SDS,HDGE,SRS,FB,MON,tsco,IMAX|B|P5,3,3
http://stockcharts.com/freecharts/candleglance.html?SLV,GDX,SIL,FNV,RGLD,trx,scty|B|P5,3,3

 Here are size and cost basis (incl commissions). 57% invested. Silver and PM miners group is 12%+ allocation, and losing 2.5% of account.
 
BAL  - 56.64 I was expecting Cotton to find support by now. More support down to 50. Weekly chart looks great - buyable dip right now. PFTargets: 51.50; longer term 89
FB    - 26.20 Chopping in a box. Support 24.70-25.70. Volume Profile (VP) improving in April.
FSCHX- 96.05 Half pos basis (25% mark-up)  $CEX stop under 368. CEX PFT 370met.  More PFT 450; 508-512.
IMAX - 27.87 Half pos.    This is possibly a Low Volatility Mover (LVM). Not a single close below 5wema for 4 months. Nothing overbought. I wanted to catch one of these for a long time. Trailing loose stop 25-26. Looking to add on strength above 28.     PFT 33; 37; 43.50
MON  - 107.17 Loss of momentum and weakness on VP. Support 97.50-98.50. PFT 98.50; 111; 133
NIB  - 29.39  Cocoa started on Mar 15, 2013 in this post (link), I bot on 3/20 and 28.  Support 29-30. PFT 37; 56
SCTY - 20.28 Half pos  PFT 28.50
TSCO - 106.06  PFT 108 (met); 126; 154
TSLA - 35.50 Half pos (38% mark-up) Short ratio came down to 13 from 21, but still 42% of float short!  PFT 41.50 and 52 met. More PFT 61; 67; 100

HDGE - 17.91
QID  - 26.49
SDS  - 45.24
SRS - 19.75 Half pos

SLV  - 28.20 Half pos
GDX - 37.61 Half pos (-23% dr-down)
SIL  - 17.80 Half pos
FNV  - 48.63 Half pos
RGLD - 68.96 Half pos
TRX -  3.04 Half pos  (-10% dr-down)

In The News:

GOLD - 4/23/13
NEW YORK--Goldman Sachs on Tuesday closed its recommendation to "short" gold, telling clients to exit bets on lower gold prices.
The bank had told its clients to bet on lower gold prices April 10.
 "Our bias is to expect further declines in gold prices on the combination of continued ETF outflows as conviction in holding gold continues to wane as well as our economists' forecast for a reacceleration in U.S. growth later this year," they said.

4/23/13 - Small Flash Crash
AP Twitter account got hacked and planted a story that two bombs detonated at the white house, injuring Obama. Lasted 5 minutes - 300,000cars ES and 50mil shares SPY. 
"Boss, we need to check the machines
No
Pleeease, we don't even know if they are working
No
Pretty please, just a few minutes
Ok, Ok, 5 minutes only
Yee-ha, hit it Lloyd!"

Thursday, April 18, 2013

Market Condition

Confidence Indicator (CI) popularized by late great Terry Laundry.He had a whole theory behind how and why it works, tested and researched for many years. The way I use it is simply a ratio of High Yield Bonds overweighted in Technology to Treasuries 15/25 years to maturity. Risk on / risk off so to say. It has an excellent success rate for divergences of this ratio to S&P500 leading to significant downside in Equities,  just like what it has now. Present divergence in price was preceded by internal weakness of indicator itself, as evident by MACD divergence.

 Bunch of other divergences present itself. New High to New Low Ratio gone negative for the first time this year. Less than half of S&P500 stocks are above 50DMA (per $SPXA50R). This is with SPX only about 3% off the highs! Also a deterioration is visible since March
Small caps and Naz100 are weak and leading down. Financials XLF dipped below 50DMA ahead of SPX.
Naz A/D indicator is very weak.

................................................................................................................
 April 19  GOLD Sentiment
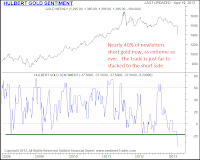
40% of newsletter writers recommend shorting Gold - this is most bearish since 2008

April 18   GOLD - Physical demand
           The U.S. Mint in April has sold 153,000 ounces of American Eagle gold coins, the highest in almost three years, after futures prices started the week by plunging the most since 1980.
Sales have more than doubled from March and surged sevenfold from a year earlier, data on the Mint’s website showed. The amount for all of May 2010 was 190,000 ounce.
          This week, retail sales and jewelry demand soared in India, the world’s top gold buyer, and China, the second-biggest, after futures in New York slumped into a bear market, touching the lowest in more than two years. Coin sales also surged in Australia.

April 17 GOLD
CME Hikes Gold, Silver Margins By 18.5%. Only big boys are allowed to play.

April 15, 2013 Monday.  GOLD  falls $150 to low 1335 (close 1361). Half of that drop happened overnight before US market opened.  Volume 657090 cars !!! Highest volume of that day came shortly after open, as gold broke 1400

April 14  GOLD - HFT 


The implication is that HFT bots driving gold down. They are perfectly designed to chew through bid structures, and that's what you see above.  They are 'digesting' all the orders that were still on the books for gold, to remove them so that lower and lower stops could be run.  Charts and explanation are from http://www.peakprosperity.com/blog/81535/gold-slam-massive-wealth-transfer-our-pockets-banks
I had no idea that Gold is liquid enough to handle these machines.

April 12, 2013  Friday.    GOLD  falls $88 to 1501
Goldman Sachs now expects gold to fall to $1,450 an ounce by the end of the year; the company’s original forecast was around $1,810. By the end of 2014, the company believes the precious metal will falter even more, falling to $1,270. Goldman’s 12-month gold outlook also fell from $1,550 to $1,390. Goldman also cut its short-term outlook, cutting its three-month forecast from $1,615 to $1,530 an ounce.

COTTON
 Beijing–through the China Cotton Association–has agreed to extend its stockpiling program of the commodity, and will renew cotton stockpiling from September 2013 to March 2014, with no upper limit on purchases.

...............................................................................................................
I will start to track some of the news. Not because it helps in routine trading. It doesn't. But because markets can't fall without some "shaking of the tree". News cycle has been very quite and benign ever since the beginning of the year, which is unnatural. I strongly believe that some of the news are in fact a "warning shot across the bow", something that changes the balance of things, but often understood only with benefit of hindsight. Still I remember very clearly that I saw right thru all the BS about Jerome Kerviel back in 2008. Kid was softly setup to take a fall for some 500 million in losses for Société Générale (SoGen is a europian equivalent of Goldman Sachs), allowing the bank to get out of massive position in US markets right before Sub-Prime crisis began.
The idea is to plot biggest news on a chart for future use.

In The News:

April 16
Letters containing deadly ricin poison received by Presidents office, some senators and judge. No casualties. Suspect apprehended 2 days later and appears crazy.

April 15 Boston Marathon Bombing. Chechen's involved.

April
        North Korea threatens nuclear attack, severs ties with South Korea. TV is full of cartunish videos of their mid-20th Century army and rockets and that fat kid (Lil Kim). It did get people scared.
        Congress coming back from vacation, get a budget from president that is bigger than before, shots down gun legislation. Starting to shake the news a bit.
        Bitcoin bubble. 40 to 265 in days, than back to less than 80 in hours.
        Japan announces that not only they will print money, but also buy bonds, stocks, ETF's and real estate for next 2 years.
        Numerous announcements of local and other taxes going up. Cost of doing business is thru the roof.

Beginning of April - Bird Flu outbreak in China. Some people died. Human-to-human transmission suspected, but denied by Chinese authorities.

Beginning of March - Cyprus bank crisis. Bank holiday, depositors looted, bailout failed, followed by rumors of their gold reserve sales. Germany approved bailout on April 18