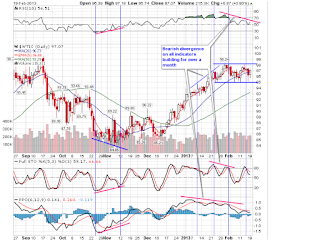
...developing...
This is going to be 8th week of non-stop advance.
Forget Tom deMark and his 9's and 13's - that guy is crazy and a fucking idiot. How i know? I actually paid money to listen to his blubber years ago, read a book and tested his ideas. Indisputably it's a bullshit, designed to collect fees and confuse muppets. People show his charts on TV, and all are in owe... well even a meteorite strikes a city ones in a hundred years, it doesn't mean we have to live underground, eh.
Back here, where I run real money:
There may be a problem with oil and entire oil/gas industry. I'm not sure what the problem is, but I see a divergence on daily chart, so starting a short. Half position only for now - all this could be OPEX shenanigans, plus contract is rolling into April.
I think I can control my bearish bias, as I was saying for a while that we are
BOT:
2/19 - SCO Half pos (Short oil)
SLD:
2/20 - ZSL Final half. Sold at target. Total profit on this trade +14%.
2/20 - TSCO 101.75 on stop -2%
2/20 - SLX 47.85 on stop -3%
2/20 - SCTY Half out. 19.10 Really 1/4, I only had half pos on
2/20 - MON 98.76 -4% Apparently there is a trial going on. I need to be more attentive to company specifics, had I know about litigation, I would never bought it. Hindsight 20/20, oops
2/20 - BHP 77.73 (S12T; BTFT) $-36.29 Emergency Exit (EE)
Positions:
http://stockcharts.com/freecharts/candleglance.html?IWM,$CEX,CG,TSLA,JJG,TBT,SLX,IBB,SCTY,CCJ,MON,fb|B|P5,3,3
http://stockcharts.com/freecharts/candleglance.html?EZA,HAO,EWS,RSX,GEO,TAN,ZSL,TSCO|B|P5,3,3
Need to do this review again, especially from stand point of taking profits;
UPDATE 2/21 Fuck taking profits, run for your life.
But seriously, when I have +1% day followed by -1.4% day it's always bad news.
I already booked about 3% profit this year (closed positions), and I prefer to control my risk, rather than hold-n-hope. Lets see how this correction goes, sell weaklings and allocate capital to strongest areas again.
2/20 was a BAD candle on all major averages, but one day doesn't make it a top. Not yet. In fact on 240min ES chart this looks like repeat of 2/4/13. Buyable dip? It's a bull market, you know...
CCJ - Support 20.50 - 21. No shorts. PFT 29.50
CG - Holding. ER 2/21. Only have 1/4pos on - its a runner. Last PFT 37 (met). All these PFT met
FB - Trailing close stop. If this turn doesn't hold - FB goes to 25, where I will look to buy it again.
$CEX- Holding. PFT 370met. More PFT 508-512.
GEO - Support 32-33 ER 2/21bmo, call 11am. CXW fell on its earn., but recovered a bit since.
IBB - stop on close under 144. PFT 150; 172
IWM - New highs without touching 20dma. PFT 88 ; 91.50 met. More targets 95; 104
JJG - Logical stop is under 53 - not sure, have PFT 52.75 (met). Possible double bottom? Last PFT 60.30
MOO -Watching reaction to 50dma
SCO -have a Half pos on. Watching reaction to 50dma (USO)
SCTY- New all time high. Support 16-17.50. Only have 1/4pos on 2/21.
TAN -18-19 is support, then 50dma. Watching
TBT - has to hold Jan low 63-64, or its a trap again. 67 - support. PFT 77-78; 87
TSLA - Holding. SR still 21! 37% of float short. 39.95 is all time high. PFT 41.50; 52; 61
Conference call is a disaster. They shoot rockets into space, but can't get a working phone. Indian CFO is a moron. Down 6% AH.
EWS -
EZA -liquidate
HAO -2/21 - at support
RSX - Fucking russians - liquidate
Pot-trade
http://stockcharts.com/freecharts/candleglance.html?MDBX,CBIS,MJNA,HEMP,PHOT,AVTC,TRTC,ERBB,SRER,GRNH|B|P5,3,3
S12T
http://stockcharts.com/freecharts/candleglance.html?GOOG,BRK/B,GE,BHP|B|P5,3,3
Watch list:
http://stockcharts.com/freecharts/candleglance.html?SPY,IGE,sea,DRYS,ORB,GSVC,DDD,RGR,yelp,soda,xlk,xlf|B|P5,3,3
http://stockcharts.com/freecharts/candleglance.html?NIB,HYG,PCY,EEM,ifn,EUO,XHB,IYR,KORS,SWI,XLB,KOL|B|P5,3,3
Short oil and gas?:
http://stockcharts.com/freecharts/candleglance.html?USO,UNG,UGA,SCO,DUG,IGE,XLE,OIH,XOP,AMJ,XES|B|P5,3,3
Graphite (looks little iffy, eh)
http://stockcharts.com/freecharts/candleglance.html?CVV,ENTG,GTI,TCK,ZOLT,FDR.V,NGPHF,FCSMF,ENZR|B|P5,3,3

No comments:
Post a Comment