Daily Global Economic Calendar

Real Time Economic Calendar provided by Investing.com.

Tuesday, October 14, 2014

Bear Market of 2014

Its here and now.

A flashy conversational item, like 'bull market' this or  'bear market' that, is not how i operate. I try not to get myself boxed in this one-way thinking. There is always a bull market somewhere, besides by the time certain type of price action is apparent - its usually too late to bet on it. Risk premium is available to be captured (both on down and up-side) before and ONLY BEFORE all information is available. Once move is complete - the game is over, then the reasons of why and who crawl from under whatever rock they where hiding, and become easy to understand in hindsight. This is theory.

In fact and as I observed in real time, this market has been acting weird since spring. It all started in April, when growth stocks, small caps and previous year market leaders shit the bed. I was not expecting this, as I assumed that treacherous range since 2000 is over and market taking off for another one-in-a-generation 20 year bull market. Long term bull market is a wonderful thing. Stocks can be analyzed on fundamental and economical basis, can be held for months (even years), as economy improves, wealth increases and society flourishes in general. I think we are overdue anyway, but its just my opinion. If and when that bull market comes, stocks still are not going to go one way all the time. There has to be periods of digestion, sideways ranges, rotations and corrections along the way, but in a general climate of growth ala "rising tide lifts all boats". Hah, you wish...

Short summer rally was mostly led by big mega-cap stocks, while small caps lingered and growth stocks generally lagged, although some had a double-digit rallies. That didn't bother me much, as I was heavily invested in biggest stocks via System 12. Personally I have mixed thoughts about so-called growth momentum leaders. Most of them are overhyped pump-and-dump scams, companies without profits, only meant to benefit insiders and bankers thru inflated IPO's and secondary offerings. A true 'stock of the future' is hard to find, as they are not widely followed until many years into expansion cycle, while price slowly climbs on no news and lackluster volume. I am always on lookout for one, but with no such luck lately.

May-June rally was nice, but not enough to rekindle animal spirits and market pretty much died going into summer vacations. Startling evidence was delivered by CSI  (Composite Score Indicator - my latest and greatest creation), as it fired a 'Sell all 11s', followed by 'OFF' sell signal across many ETF's and especially 9 Main Spiders on and right after week of June 30th. Of course I didn't know it at the time, I only started CSI testing back then, so its all in hindsight. (Damn thing was so complex - it took me all summer to organize, test and put it to work). Nevertheless, I was alert to sudden softness and while August drop didn't hurt me at all, my portfolios made very little progress on following rally.

I noticed a very careful selling in a beginning of September by some clever operators, and it wasn't unexpected at-all (at least by me). Working thesis was as follows: almost every year there is a 'sell Rosh-Hashanah - buy Yom Kippur' phenomenon, as some heavy hitters sell out most of their active portfolios in order to not to be distracted during high holidays. That was followed by Sukkot, culminating with full lunar eclipse on full moon during last weekend - a truly spectacular display I observed during early morning hours. Knowing about all this coming up, and taking into consideration 31 days wash sales period, and getting confirmation from MADI (My Advance-Decline Indicator) over a month ago, I assumed that they front-running all this shit in order to be ready to buy in October. I lighten up for a while too, then started to accumulate what look good and strong. The problem was - there wasn't too much to choose from, still I waited to see some improvement...  Well, we are here, but I don't see any buying. Quite the opposite - its a full blown panic, a carbon copy of 1987 or 2011 (minus the crisis).

Hopefully, the bottom is within reach, but hope is not a strategy. To be sure I don't get swept away, my account is 50% cash, but I was 150% long like a split second ago, so there is no 'ata-boy pat on a back' for Bergamot. I have tools and methods to buy all this crap back and more, as well as some levels that will take me completely out of the market... one day at the time... This year has been a complete fucking disaster for actively managed BCM account, putting my own equity curve firmly into Bear Market territory (extra Marc Faber).

So far its my 3rd worst year ever... shiiiit

...it ain't about how hard you hit, it is about how hard you can get hit and keep moving forward, how much can you take and keep moving forward. That's how winning is done!

Wednesday, September 17, 2014

System 12 Plus. 9-2014

.this update covers activity from 9/18/14 to 10/15/14.

System12BCM:
http://stockcharts.com/freecharts/candleglance.html?MSFT,BRK/B,PTR,PG,IBM,GOOGL,JPM,JNJ,WFC,WMT,GE|B|P5,3,3|0

Still can't get it Fully Loaded.
PS: and then I found out why it was so hard to get it loaded - the whole market crap out.
I held a bit longer than I should. Breaking and bending some of the rules is happening again, and now really costing me more then necessary. Bergamot is deeply dissatisfied...

BOT: NVS on 9/30; CHL on 10/7
SLD: PTR on 9/22; IBM on 9/25; GE on 10/1; GOOGL, JPM, NVS, JNJ, BRK, MSFT, WFC on 10/13
DIVI received: PTR


This is MD:
http://stockcharts.com/freecharts/candleglance.html?AAPL,XOM,GOOGL,MSFT,BRK/B,JNJ,RDS/B,WFC,GE,NVS,CHL,WMT|B|P5,3,3|0

 MD Control: PTR out; NVS in - both slipping in and out
 XOM, GE, WMT are still toying with 'disqualified'.
I don't have AAPL (for a moment), XOM, NVS, and CHL due to Operator Error.
Earnings start  with JNJ on Oct 13, followed by banks.

This is SD:
http://stockcharts.com/freecharts/candleglance.html?PTR,CVX,PG,JPM,HSBC,VZ,TM,FB,IBM,PFE,KO,ORCL|B|P5,3,3|0
I have PTR, PG, JPM, IBM
BHP out, ORCL back in, FB moving towards MD (what??!)

This is Arnott Overlay (AO) : XOM, GE, WFC, BRK, AAPL
 RAFI 1000 index was rebalanced. Most recent weightings are here (link). Last check 7/29/2014.
 http://stockcharts.com/freecharts/candleglance.html?SPY,PRF,XOM,CVX,GE,WFC,BRK/A,AAPL,JNJ,MSFT,JPM,ibm|B|P5,3,3|0

 Arnott Overlay and System12 Select Theme (AOS12s) of System9.
 As of 9/17 it holds BRK, MSFT, GOOGL, IBM, JPM, JNJ, WFC, WMT, GE , and out of AAPL for a moment. Somehow I forgot to buy PG, when i bot it for S12. It's ok, since I have more than I allowed, waiting for inevitable stop-out to take care of that soon.

 EEBL include: IBM, MSFT, WFC

 http://ibergamot.blogspot.com/2014/08/guru-puja.html
GURU holdings include these S12 stocks: AAPL,  JPM,  WFC
Since mid August, GURU etf changed about a dozen holdings. MSFT, PG where amongst sold ones.
New additions include FB (omg!), HPQ, TMUS, but these are of interest:
http://stockcharts.com/freecharts/candleglance.html?AKAM,CFX,ENDP,STAY,FMC,HMHC,TMO|B|P5,3,3|0


KREM September 2014
Continuing massaging that summer idea   http://ibergamot.blogspot.com/2014/08/krem-v1.html
I changed selection criteria a bit, resulting in replacing SOCL with XRT. There are a bunch of financial ETF's coming up (like IAI, KRE etc), so I decided to go with XLF to cover them all. Swapped XES for OIH - they are basically dupes, but I still can't pick which one is better. I like the fact that different set of guidelines didn't make much difference on index composition. Unfortunately I am not too sure how best to use KREM Index. Its not an index of market leaders, just stuff that moves... up and down.
http://stockcharts.com/freecharts/candleglance.html?TAN,GDX,XOP,OIH,URA,IBB,XME,XRT,XPH,XHB,XLF,XLU|B|P5,3,3|0

Monday, August 18, 2014

System 12 8-2014. 'Operator Error'

 .this update covers activity from 8/18/14 to 9/17/2014.

System12BCM:
http://stockcharts.com/freecharts/candleglance.html?MSFT,BRK/B,AAPL,PTR,PG,IBM,GOOGL|B|P5,3,3|0

 System 12 is still light with 5 slots available.
I made a serious mistake. While S12 was light, and there was nothing I could take from MD, I was suppose to go for any available of SD. Specifically CHL and HSBC were on my list to buy, but I didn't (for whatever misguided reason). Now China Mobil (CHL) is in Mega Dozen, extended as fuck, without me in it. I don't know how to deal with such 'operator error' - I was supposed to play the system, instead I decided to screw with it. Not good...
I think its only second Emergency Exit (EE) since S12 started, and it happened on AAPL just a couple of days from big announcement... two phones and a watch... lol

BOT: JPM on 8/19; JNJ on 8/21; WFC on 8/29; WMT on 9/3; GE on 9/8
SLD:  AAPL on 9/3 EE!
DIVI received: MSFT, JNJ
FB, BHP, IBM, PFE

This is MD:
http://stockcharts.com/freecharts/candleglance.html?AAPL,XOM,GOOGL,MSFT,BRK/B,JNJ,RDS/B,WFC,GE,CHL,PTR,WMT|B|P5,3,3|0

MD Control: CVX, NVS out; CHL, PTR in
XOM, GE, WMT are toying with 'disqualified'.
I don't have XOM, WFC, JNJ, RDS/B, GE, WMT, CHL
I don't see any earnings coming up.

This is SD:
http://stockcharts.com/freecharts/candleglance.html?CVX,NVS,PG,JPM,HSBC,VZ,TM,FB,BHP,IBM,PFE,KO|B|P5,3,3|0
T is out; KO is in
I have PG and IBM; PTR moved up into MegaDozen (MD).

This is Arnott Overlay (AO):
XOM, GE, WFC, BRK, AAPL for 20% each
RAFI 1000 index was rebalanced. Most recent weightings are here (link). Last check 7/29/2014.
http://stockcharts.com/freecharts/candleglance.html?SPY,PRF,XOM,CVX,GE,WFC,BRK/A,AAPL,JNJ,MSFT,JPM,ibm|B|P5,3,3|0

Arnott Overlay and System12 Select Theme (AOS12s) of System9.
As of 8/18 it holds BRK, MSFT, GOOGL, IBM and i will gladly buy standard size positions of anything that gives an entry (up to maximum allocation of 25% of portfolio)
GURU holdings include: AAPL,  JPM, MSFT, PG, WFC
EEBL include: IBM, MSFT, WFC

Sunday, August 10, 2014

KREM v1

Meaning of word 'krem' from UrbanDictionary (link) :
A crazy ass motherfucker, who can not calm down, doesn't give a shit what he says, and acts extremely black for the white tone of his skin.
No its not that.
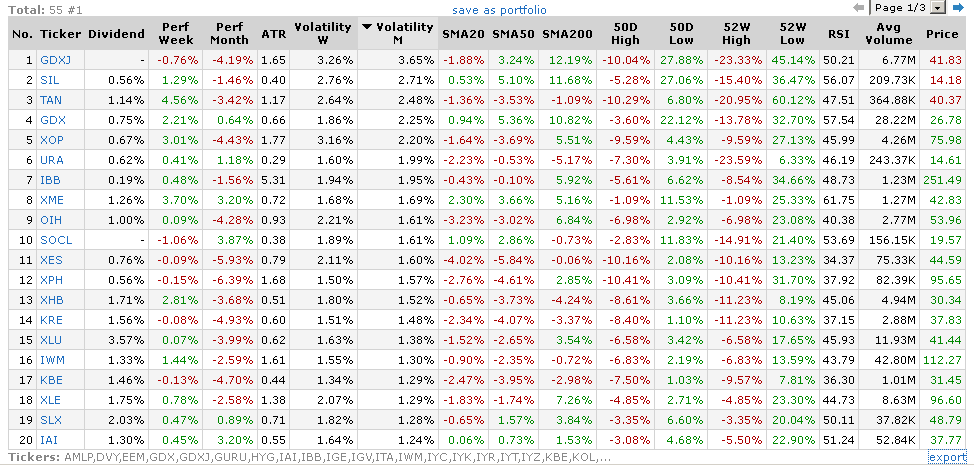
I got a couple of interesting ideas from Perry Kaufman (link), about rotating through a list of ETF's. This way of thinking is actually quite natural for me, as I compiled a list of all kinds of etf's over past few years. Actually 55 US long-only, non-leveraged equity etfs, covering soup to nuts of investable stock universe. There are, of course, several ways to use it. Version 1 takes on most volatile and highest performing etf's, with goal to trade them opportunistically for a meaningful swing. In honor of industrious Mr. Kaufman (who wrote 1200 page book, covering every investment topic known to men), I call this thing KREM - Kaufman Rotational ETF Method.

List:
AMLP,DVY,EEM,GDX,GDXJ,GURU,HYG,IAI,IBB,IGE,IGV,ITA,IWM,IYC,IYK,IYR,IYT,IYZ,KBE,KOL,KRE,MDY,MOO,OIH,PFF,PHO,PPH,PSP,QQQ,REMX,SEA,SIL,SKYY,SLX,SMH,SOCL,SPY,TAN,URA,VGT,XES,XHB,XLB,XLE,XLF,XLI,XLK,XLP,XLU,XLV,XLY,XME,XOP,XPH,XRT
Finviz link
8/2015. add FFTY, HACK, ITB.
10/2015. add MarketVectors retail RTH. Also RTH is bigger than XRT (equal? weight retail from SPDR)
12/2015. add FDN - internet with FANG at 35%

10 most volatile, highest performing funds selected, after removing duplicates and applying a filter. Then 2 additional etf's added to improve diversification. This becomes KREM Index, equally weighted and rebalanced monthly. I will update it between 5th and 10th.

KREM August 2014 Index:
http://stockcharts.com/freecharts/candleglance.html?TAN,GDX,XOP,URA,IBB,XME,SOCL,XES,XPH,XHB,KRE,XLU|B|P5,3,3|0
Best performer - XME
System12 Qualified  - GDX, XME, SOCL, XOP, XPH, XLU


They may not look too hot right now, but only 10 etf's are up for a month, so ... One thing I can say about this index components for sure is: They Move! All my efforts need to be confined to this list for the month until rebalanced. The only snag is portfolio impact - I really don't want to heavily overweight anything. Considering that I already have corresponding industry components as open positions, I removed XOP, XPH, GDX and replaced them with SLX, KOL, SEA at my sole discretion.

KREM BCM Action List (KAL):
http://stockcharts.com/freecharts/candleglance.html?TAN,URA,IBB,XME,SOCL,XES,XHB,KRE,XLU,slx,kol,sea|B|P5,3,3|0

Understanding, I rather trade correlated stocks in groups vs etf's/funds, still KREM considerably narrows down my instrument selection. This strategy needs to be applied to System9, but i still have some kinks to be worked out.

There is also another possibility, I haven't tested yet.
9 main spiders - is essentially the whole market.
First of all I am curious to see how they respond to CSI, as I think its the best way to construct average market CSI score - an ultimate tool I've been dreaming of... lol. Of course, there is no 'holy grail', its just an illusion (hopefully not delusion), but I would like to add some kind of broad market indicator to compliment MADI. There is nothing out there to help me answer the most important questions: WHAT to buy, WHEN to do it, HOW to bet, WHY to sell. I have to keep figuring this out myself.
Secondly, considering that 9 main sectors are lower-volatility than most on my list, I wonder what will happen to portfolio of corresponding Fidelity mutual funds? I can allocate to best performing, overweight according to CSI, time entry by MADI, re-balance monthly for free. I think S12 exit rules are the best for this, as they allow to stay in the longest and re-enter quickly, but it remains to be seen

========================================================

KREM 2014:
http://stockcharts.com/freecharts/candleglance.html?SPY,QQQ,IWM,MDY,EEM,HYG,DVY,PFF,PSP,GURU,AMLP,XLU|B|0
http://stockcharts.com/freecharts/candleglance.html?XLK,SMH,VGT,IGV,IYZ,SOCL,SKYY,XLF,KRE,KBE,IAI|B|0
http://stockcharts.com/freecharts/candleglance.html?XME,GDX,GDXJ,SIL,KOL,SLX,IGE,XLE,XOP,XES,OIH|B|0
http://stockcharts.com/freecharts/candleglance.html?XLI,XLB,XHB,IYR,TAN,URA,REMX,PHO,MOO,SEA,IYT,ITA|B|0
http://stockcharts.com/freecharts/candleglance.html?XLV,IBB,XPH,PPH,XLP,XLY,XRT,IYK,IYC|B|0
8/2015. add FFTY, HACK.

Wednesday, August 6, 2014

Guru Puja

I often say that 'Luck favors prepared'.

Apparently this is loosely based on famous Seneca quote: "Luck is what happens when preparation meets opportunity". To the best of my knowledge,  Seneca the Youngest was the earliest recorded bond speculator in human history. While being an advisor to Roman Emperor Nero, he managed to force some 'big loans' on British allies of Rome, only to call them back at most 'opportune' time. Bond panic ensued, followed by revolt led by Queen Boudica, lest not forget almost 100,000 killed in uprising. In a year 62AD, Seneca became one of richest citizens of Rome.

'Guru' means 'teacher' in Sanskrit. I don't have one. Which makes me an 'Anatha', or 'the one without a teacher'.

I had many indirect teachers in a way of books and blogs, but after reading and studying for years, I still have many of same concerns. Especially so with modern day bloggers. I can say from personal experience, that its all but impossible to be an active trader/investors and also pursue a writing/publicity career at the same time. The people who know how to make money in the markets don't need AdSense income, unlike majority of financial blog writers who can't tell shit from shinola.  IMNSHO, reading blogs waists time, is a distraction, often source of misinformation or somebody's agenda, spreads fear (because it attracts muppets like flies), and generally full of bullshit. Plus they always trying to sell me something. I can sell myself, if I would want to... , but I refuse to become a scammer. I rather just to follow the money.

I learned to read stock charts to find 'breadcrumbs'- traces of  Big Money, often buying something alongside famous money managers (of course, that info comes out too late). The problem is - it happens not often enough. The idea of following approach is to position myself in the middle of their universe...

I have to admit, it's a bit of short-cut.

Programming note: this method is labeled 'GURU'.

------------------------------------------------------------------------
GURU ETF from GlobalX tracks  Top Guru Holdings Index made by index gurus of Structured Solutions AG, Germany. They compile a list of 50 most invested stocks, reported by top hedge funds in their Form 13F. There is a lag in when these purchases are reported, and again for allocation into etf. Supposedly they lean towards managers with low portfolio turnover, so I assume that stocks are locked away for 6-18 months. It doesn't mean they always right, only that there is (or was) a large monetary bet with reasonable expectation of gain. Composition is rebalanced often, so I will check in the beginning of every month, around 5th. I think that a new positions will have a higher chance for success. I don't know how large the rotation really is, don't have any historical data, so will have to study in real time.
http://www.globalxfunds.com/GURU
http://etfdb.com/etf/GURU/

Finviz screen as of 8/5/2014 here (link).
 After taking out stocks I already have in System12 or elsewhere, and focusing only on issues above 50/200ma, I am left with only 11.
http://stockcharts.com/freecharts/candleglance.html?GURU,AMX,BIDU,PCLN,EMC,AMT,CP,HES,CCI,CIT,SAVE,BURL|B|P5,3,3|0

 The plan is to take any sound technical entry with stop-loss near by; and then half-out on any pop, to secure early gains. Don't care about any fundamentals or news, assuming that somebody already done that, or maybe there is something else at play. These stocks span the whole gamut of investing universe - variety of industries, from absurd P/E to no/E, from 32% SI in S to no shorts at all in ING, from 52 week high to yearly lows. GURU holdings are big stocks - most are over 10bil market cap, smallest is 1.6bil (CACI).
----------------------------------------------------------------------------

While Digging (post link) in April, I rounded up some local gurus.

Clever Eddy Elfenbein of CrossingWallStreet.com, proclaimed a 'best buy-and-hold blogger', with his Buy List. A collection of 20 stocks, set in a beginning of the year. He mentioned that not all should be held continuously. This fits with my efforts to trade opportunistically the very best, sound businesses.
Latest rundown: http://www.crossingwallstreet.com/archives/2014/08/cws-market-review-august-15-2014.html

Eddy Elfenbein Buy List (EEBL):
http://stockcharts.com/freecharts/candleglance.html?$SPX,IWM,VTV,VUG,AFL,BBBY,CA,CTSH,BCR,DTV,EBAY,ESRX|B|P5,3,3
http://stockcharts.com/freecharts/candleglance.html?FISV,F,IBM,MCD,MDT,MSFT,MOG/A,ORCL,QCOM,ROST,SYK,WFC|B|P5,3,3

That man has been a fruitful source of great research ideas. One of his latest gems is a list of 52 'dull' stocks of well-run, profitable companies that get very little or no coverage by analysts and media. I have never heard about most of them, which makes me very very very curious.
http://www.crossingwallstreet.com/archives/2014/08/the-dull-stock-portfolio.html
Thanks, Eddy

------------------------------------------------------------------------
Old Man Buffet
 Here is his top 2 dozen as of end 2013, from WFC 20% to MTB at 0.5% of portfolio:
http://stockcharts.com/freecharts/candleglance.html?WFC,KO,AXP,IBM,PG,XOM,WMT,USB,DTV,DVA,GS,PSX|B|P5,3,3
http://stockcharts.com/freecharts/candleglance.html?MCO,GM,GHC,USG,BK,CBI,COP,LMCA,NOV,VIA,VRSN,MTB|B|P5,3,3
Notable that BAC is not here, but actually its his 5th largest position (thru warrants and shit...).
http://whalewisdom.com/filer/berkshire-hathaway-inc
-----------------------------------------------------------------------

Very Smart Robert Arnott of Research Affiliates and his RAFI family of indexes, providing yet another view of investment selection. Arnott Overlay (post link) in spring of this year turned out to be just a start of this cross-strategy project, in effort to 'follow the money'.

  ...Much to be discovered...

Tuesday, July 29, 2014

System 12 - Q 2, 2014

.this update covers activity starting on 7/15/14 through 8/15/2014.
I am way late on this update, although I recorded the data on time, and there are some changes.

System12BCM:
http://stockcharts.com/freecharts/candleglance.html?RDS/B,MSFT,CVX,BRK/B,AAPL,PTR,XOM,GOOGL|B|P5,3,3|0

Open positions of System 12 are light. I was hoping that some of stop-outs would recover, but while some are questionable (specifically WFC), others are gone for now (like GE). I can buy back any sold position after 5 day Positioning Period (PP) elapsed, disregarding wash sales. System12 goal is to lean towards Mega Dozen (MD), but I can not stay light - I have to go for Second Dozen (SD). 4 open slots is alot, I am a bit worried.
UPDATE 8/5: after all recent stop outs, now I only have 4 positions left. I wasn't worried for nothing...he-he. System 12 is protecting itself, as it should, but really-really need to be buying something...really...

BOT: WMT on 7/16 (but then out on 7/25); PG on 8/6; IBM and GOOGL on 8/13
SLD: WFC on 7/17;  GE and JNJ on 7/21; NVS on 7/25; WMT on 7/25;  RDS on 7/30;  XOM on 7/31;  CVX and GOOGL on 8/1 (bought Google back 2 weeks later)
DIVI received: GE, PTR, AAPL
 IBM, FB, BHP, PFE, T

This is MD:
http://stockcharts.com/freecharts/candleglance.html?AAPL,XOM,GOOGL,MSFT,BRK/B,JNJ,RDS/B,WFC,GE,WMT,CVX,NVS|B|P5,3,3|0

No changes to MD.
GE and WMT are toying with 'disqualified'.
I don't have WFC, JNJ, GE, WMT, NVS, and by 8/1 RDS, XOM, CVX, GOOGL
 2nd Quarter MD 2014 earnings score
(only initial reaction considered, regardless if stock recovers or not):
All reported:  6 up; 6 down (just like last quarter).
Earnings: XOM July 31,  CVX Aug1, WMT Aug 14

This is SD:
http://stockcharts.com/freecharts/candleglance.html?PTR,PG,JPM,CHL,VZ,TM,HSBC,IBM,PFE,T,FB,BHP|B|P5,3,3|0
ORCL and BUD out; BHP and FB in... Facebook!!!???
I have PTR

This is Arnott Overlay (AO):
XOM, CVX, GE, WFC, BRK, AAPL for 15% each
RAFI 1000 index was rebalanced. Most recent weightings are here (link).
Of note: MSFT and JNJ just missed top 12 rafi, while JPM just under MD
http://stockcharts.com/freecharts/candleglance.html?SPY,RSP,PRF,XOM,CVX,GE,WFC,BRK/A,AAPL,JNJ,MSFT,JPM|B|P5,3,3|0

 Arnott Overlay and System12 Select Theme (AOS12s) of System9.
As of 8/5 it only holds BRK and MSFT, but i will gladly buy standard size positions of anything that gives an entry (up to maximum allocation of 25% of portfolio)
GURU holdings include: AAPL,  JPM, MSFT, PG, WFC

Monday, July 14, 2014

Summer


Summer market leaders.

Simple Finviz scan:  consider any reasonable stock (over 300mln market cap, $10+, at-least 500K volume), of profitable company with very low or no debt. I want something that doubled in past 12 months, and still above 50/200 day ma. With S&P continuously pushing all time highs, should not be a problem to find many of these. Right? Wrong! Only 12 plus FaceBook.
http://www.finviz.com/screener.ashx?v=111&f=cap_smallover,fa_debteq_low,fa_pe_profitable,sh_avgvol_o500,sh_price_o10,ta_highlow52w_a100h,ta_sma200_pa,ta_sma50_pa&ft=3&o=-marketcap
These are the leading stocks: internet and shit, couple of biotechs, airline. Three Chinese. XRS pays 7% divi. AMBA and RGEN unter 1bil. Very high short interest in QCOR, WUBA, LOGI, AMBA, RGEN
http://stockcharts.com/freecharts/candleglance.html?GMCR,AVGO,SWKS,AMBA,WUBA,BITA,SYNA,LOGI,QCOR,RGEN,SAVE,XRS|B|P5,3,3|0

----------------------------------------------------------------------

Here, courtesy of ZeroHedge, is a  page of 1st issue of Wall Street Journal on July 8, 1889.

Colorful annotations draw shocking parallels between trials and tribulations of distant past and today's news. Like I mentioned before, nothing ever changes. Not in human affairs, nor in markets. Ever...

http://www.zerohedge.com/news/2014-07-08/125-years-ago-or-today
Thanks, Tyler

Here is more:
http://graphics.wsj.com/wsj-125-history/
http://blogs.wsj.com/wsj125/2014/07/07/july-8-1889-the-first-wsj/

 ----------------------------------------------------------------
Marc Faber, Schiff, and Gartman talk markets
Oy Vey Iz Mir, you know...


-------------------------------------------------------------------------
 John Williams of ShadowStats talks at length about gov statistics mambo-jumbo, and how distorted it is, comparing to old ways of dicing and slicing of economic data. For only 175/year, responsible Mr. Williams delivers reshuffled economic reports, based on 'right' methodology.... no, I will not be cursing here...
Still, interesting talk, worth a listen... minus f@%#ing statistics
http://www.shadowstats.com/


-------------------------------------------------------------------------
Robert Kessler of Kessler Investment Advisors shorted bonds while long term bullish. ... Because 'its reasonable to be careful'... Classic... But really, these are the guys who ALWAYS win, even when they losing... He-he
Thanks, Consuelo
http://wealthtrack.com/recent-programs/robert-kessler-bullish-treasuries/

--------------------------------------------------------------------------
Old School Charlie Munger in 2009, talks about idiot boom, false competitiveness, and Berkshire investment tricks.
Plain spoken, rare these days.


--------------------------------------------------------------------------


Saturday, June 28, 2014

System 14 - Equiponderator


I realized the need for new System 14 back in early May of 2014, while sitting in 50 Day Box (post link).

System 14 (S14) invests in long weekly-monthly trends, rotating thru major asset classes of stocks and bonds. It is rule based, with simple set of risk controls and filters, and diversified.
The account is held at Vanguard. I can invest in mutual funds only, long only, no margin. Previously referred to as System 1 account, effectively stopped in 2013.

The account is a basic retirement structure, common in 401K / IRA, meaning money grow tax-free and not being withdrawn now, nor in foreseeable future. These are all advantages and accumulate over time to the benefit of shareholder. There is no free lunch on Wall Street , so in accordance with Dow Paradox (post link) there is a price to pay. These type of accounts are limited in what they can hold in general, and this one even more so. Why I give myself even more headache? Diversification! That's why. Don't put all your eggs in one basket, as the old saying goes. I reflected on subject of diversification in winter of 2013 in this post (link).
My #1 Big Thought about investments is : Split your money between different institutions!

Every once in a while Shit Hits the Fan (SHTF) in the Markets, bunch of institutions blow up... and take their clients money with them. The last time it happened in a massive way was in financial crisis of 2008-2009, when several prominent firms went under and lost all or some Assets Under Management (AUM) in a process. Panic was so deep, that even Money Market Funds (virtually risk-free very low interest deposit) where threatened. Some of biggest houses made announcements of guaranty and excess collateral for custodial funds. The first two to step up where Vanguard and Fidelity, proving that I picked right place to do business, as I am client of both. I'll call it luck... many people where much less fortunate.

The case of MFGlobal in October 2011 involved outright fraud and theft of clients funds to the tune of BILLIONS dollars! Granted that most of people eventually got most of their money back, resolution took years and completed just recently. Meanwhile  money where not available for investments, and where effectively shut out of chance to participate in tremendous gains of past couple of years. Not to forget that is was whatever money where left after disastrous bankruptcy and liquidation, that had individual and institutional accounts frozen during full-fledged market meltdown. People where unable to close position during unabated market drop, just looking at accumulated losses, only allowed to sell at the very bottom. It looks small and relatively benign now, on a lower left corner of 3 year chart, but 2011 was a real-deal bear market. I remember that nightmare, as if it was yesterday. I traded thru that shit. In fact, and as evident by Commitment of Traders (COT) report, that experience was so dramatic that it caused many traders to walk away and never to come back. October - November 2011 was a true panic bottom from which this current bull market originated.


So I have this sizable account at one of the best houses on a Street, where its safe (no jinx), enjoys favorable tax treatment, luxury of time and some of lowest costs in industry. I can buy any Vanguard mutual fund with all dividends automatically reinvested, based on rules of what to buy, when to do it, how to add and why to sell. The complete balance of all nessesary information - The Equiponderator.
 The Way of the merchant is always to live by taking profit.
- Miyamoto Musashi, 1645
I really don't know the future. I only see what is now, here, in front of me. I am using my life experience, accumulated knowledge and (stunningly uncommon) common sense to guess where it goes from here, in order to invest into instrument offering greatest potential. I have to do it without relying on forecast, because there is no practical or dependable way to know the future. But I know this: Nothing ever changes in a way of human events, because human nature never changes. Life and markets go thru periods that can not be foretold, but emotions never change. Fear, greed, envy, jealousy, etc, etc.  In order to design The Way to win the battle for market profits I want to learn from the original thinkers of the past, but my actions are here and now.


I was the third brother of five
Doing whatever I had to do to survive
I'm not saying what I did was alright
Trying to break out of the ghetto was a day to day fight

Been down so long, getting up didn't cross my mind
I knew there was a better way of life and I was just trying to find
You don't know what you'll do until you're put under pressure
Across 110th Street is a hell of a tester


Wednesday, June 18, 2014

System 12 6-2014

.this update covers activity from 6/18/14 to 7/14/14.

 Thanks to clever Eddy Elfenbein for reminding me about this great quote:
 “In this game, the market has to keep pitching, but you don’t have to swing. You can stand there with the bat on your shoulder for six months until you get a fat pitch.” – Warren Buffett

 System 12 BCM:
http://stockcharts.com/freecharts/candleglance.html?WFC,RDS/B,NVS,MSFT,CVX,JNJ,BRK/B,AAPL,GE,PTR,XOM,GOOGL|B|P5,3,3|0

I didn't do update on System12 in May, because there where no changes to MD, and with S12BCM fully loaded I decided that there is no reason to mess with perfection. I have 5 positions up more than 10%, and 3 more approaching, led by RDS up 15%+. Dividends piling up. Green across the screen. BRK may be going by-pass, but no worries until 125 is lost.

SLD/BOT: no changes.
DIVI received:  RDS/B

ORCL, PFE, IBM, T, BUD

This is MD:
 http://stockcharts.com/freecharts/candleglance.html?AAPL,XOM,GOOGL,MSFT,BRK/B,JNJ,WFC,GE,RDS/B,CVX,NVS,WMT|B|P5,3,3|0
WMT dis-qualified by a smidge.
RDS  not sure when earnings.
I don't see any earnings reports (ER) in June.
WFC July 11; GOOGL, JNJ  July 14; GE July 18

This is SD:
http://stockcharts.com/freecharts/candleglance.html?PTR,PG,JPM,VZ,TM,CHL,HSBC,ORCL,PFE,IBM,T,BUD|B|P5,3,3|0
BHP out, BUD in, ORCL moving up to #20.
I have PTR.

 This is Arnott Overlay (AO):
http://stockcharts.com/freecharts/candleglance.html?SPY,RSP,PRF,XOM,GE,WFC,MSFT,CVX|B|P5,3,3|0
JPM removed due to drop from MD, although it did recover post-earnings gap, I had to close it per exit rules. I would lose less, had I exited promptly without by-pass.
These positions are held at normal size in BCM account, since all (except CVX) where opened prior to my discovery of AO.
I decided to treat Arnott Overlay as a stand-alone System9 Theme in LB account, with several changes. First of all, I want to be able to add 1 or 2 stocks from S12BCM at my discretion. Presently these are GOOGL and BRK. Position size is standard (for LB) to slightly overweight, with System9 exit rules. As such, this new Arnott Overlay and System12 Select Theme (AOS12s) became one of my main Themes, with maximum allowed allocation of (slightly under) 25% of portfolio.
Yep, I believe in System12 THAT MUCH!

------------------------------MID-YEAR CHECK----------------------------
System12 is functioning just fine, thank you very much. All good, or better.
Red Line is where my meat is.
System12BCM AUM real data including commissions, fees and dividends.
Year to date performance is similar to S&P500 (index and SPY)
 ----------------------------------------------------------------

Tuesday, June 10, 2014

Select Themes Review and Update

There are some Themes that kinda active, but phasing in and out mostly due to unending bear market or lack of correlation. I think Themes need to be reviewed in general at-least once a year to make sure that fundamentals didn't change much, see if big stocks lead or small, see if weightings of stocks in corresponding ETF's where rebalanced, but mainly to update watch lists. If my assumptions about industry or situation are correct, then price action will confirm. Otherwise I would have to deal will long grind and pain of System8... I would rather not... a have much better methods in System9 and System12.

Do nothing which is of no use.       -Miyamoto Musashi, 1645-

Uranium for Sale

And getting cheaper everyday. Every rally was sold to new lows since Fukushima accident in 2011, even thou there are many more nuclear power stations being build all around the World. They can't run base load of a solar panel. Really.

Top ETF is URA from Global X, with 0.7% fee, only 200mil in assets, and down 70% from inception in 2010.
http://www.globalxfunds.com/URA
Top 3 holdings: CCJ, DNN, URPTF (proxy for price of U92) - together almost 50% of fund. It also include several companies not traded in US - Australian Syrah, French Areva, etc.
USU filed for bankruptcy in March. Its happening...!
http://stockcharts.com/freecharts/candleglance.html?NLR,URA,CCJ,DNN,URZ,UEC,URG,URRE,UUUU,URPTF,PALAF,FCUUF|D|C20|0

CCJ is the only real company, DNN comes a distant second. UEC (with huge short in it) and UUUU are Mickey's 'sponsors'. The other little ones attracted some inst. buying...lol... What a fucking mess... But correlated, active and with enough volume.
More here: http://investorintel.com/nuclear-energy-stock/
Different view of industry: https://www.motifinvesting.com/motifs/nuclear-renaissance#/overview

NLR is a tiny (only 75mil) ETF from MarketVectors invested by 70% into utilities known to use nuclear power. Like DUK, NEE, SO, D, PPL etc. I already have them in utility mut fund in System9.
http://www.vaneck.com/market-vectors/equity-etfs/nlr/snapshot/

-------------------------------------------------------

Shippers on Deck

I made a Discovery at Sea (post-link) a little over a year ago. Shipping companies made me alot of money, even when I traded them short term. I wish I decided to focus more on dividends and hold them longer, as market happened to accommodate. Industry dynamics didn't change much over this year, top 20 are almost the same and look much better than smaller stocks.
http://stockcharts.com/freecharts/candleglance.html?$BDI,SEA,KEX,TK,GLNG,TGP,TOO,SSW,GMLP,GLOG,SFL,CMRE|C|C20|0
http://stockcharts.com/freecharts/candleglance.html?NVGS,DRYS,NMM,CPLP,MATX,NM,DSX,NAT,SB,DLNG,dac,vlccf|C|C20|0

SEA is a small (120mil) illiquid ETF with 0.7% exp ratio. Largest holding, at maximum allowed allocation of 20%, is Maersk. There is no other way to invest in it from US I'm aware of.
http://guggenheiminvestments.com/products/etf/sea
Considering how well correlated top of list is, I will exit SEA from BCM account (on either a close stop or next rip) , wait an obligatory month (damn wash), and begin taking shippers. System9 will keep SEA until multiple sell signals accumulate.
These are not my smoothest moves... he-he

------------------------------------------------------

Pot(ty) Training

Marijuana Theme quickly turned into pump-n-dump. So many new penny stocks where listed here and in Canada, and promptly proceeded down by 50-90%.
I am well trained to work thru this shit.  Gold stocks now, Rare Earths before, Home Builders awhile ago - I've seen this movie more than once. Selling most of pot stocks on last rip was a wise decision, and not a hard one to make at 500-1000% profit. Really, hundreds into thousands... nicccce
Now picture is muddy, but I still think we will know more after elections. Its not over.
Looking to reload with tiny size positions...lol
http://stockcharts.com/freecharts/candleglance.html?MDBX,CBIS,MJNA,HEMP,PHOT,AVTC,TRTC,ERBB,GRNH,GWPH,CANN,canv|B|P5,3,3|0
http://stockcharts.com/freecharts/candleglance.html?FSPM,MCIG,NVLX,VAPE,ATTBF,EXMT,GWPRF,HSCC,LATF,NTRR|B|P5,3,3|0

More here:
http://marijuanastocks.com/content/list-marijuana-stocks
http://money.msn.com/investing/14-cannabis-stocks-to-watch-in-2014-1

------------------------------------------------------------------------------

Raring for Rare Earths

I tried to buy Rare Earth stocks (my old fetish) about a year ago, but it didn't take. Situation is largely the same: these companies are either a fraud, or a delusion. Nobody talks about them, dedicated forum is all but empty. The only two companies doing something is still MCP and LYSDY, both down about 70% from year ago.

In a life of mining company, this period between exploration and production is called "Valley if Death"... indeed it is. Many blown up or sold, most of remaining will not survive in their present form. I am controlling my eagerness to buy some, but several good looking set-ups are present for at-least a meaningful bounce. Also watching related items in titanium, palladium, lithium and antimony.
Start here:
http://stockcharts.com/freecharts/candleglance.html?REMX,RTI,TC,REE,TAS,GMO,LYSDY,MCP,PAL,UAMY,uuraf,LIT|B|P5,3,3|0

-------------------------------------------------------------------------------------

Mother Russia 

Come on Vladimir Vladimirovich, the World is watching...
http://stockcharts.com/freecharts/candleglance.html?$RTSI,RSX,CTCM,MBT,MTL,QIWI,VIP,YNDX,OGZPY,SBRCY,NILSY,LUKOY|B|P5,3,3|0

========================================================

--------------------Watch List----------------------
I trade only my own watch list... exceptions are futile

http://stockcharts.com/freecharts/candleglance.html?MHFI,GEO,CXW,DVA,LO,WDC,IMAX,CHKP,XON,GS,CG,tsla|B|P5,3,3|0
http://stockcharts.com/freecharts/candleglance.html?DBA,JJG,MOO,MON,ADM,POT,MOS,HRL,TSCO,LNN,CRESY,SQM|B|P5,3,3|0
http://stockcharts.com/freecharts/candleglance.html?XHB,LEN,DHI,PHM,TOL,WY,PCL,RYN,PCH,EXP,TXI,mlm|B|P5,3,3|0
http://stockcharts.com/freecharts/candleglance.html?URA,CCJ,DNN,URZ,UEC,URG,UUUU,URPTF,CVV,GTI,ENTG,fcsmf|B|P5,3,3|0
http://stockcharts.com/freecharts/candleglance.html?$BDI,SEA,KEX,TK,GLNG,SSW,SFL,CMRE,DRYS,NM,MATX,VLCCF|B|P5,3,3|0
http://stockcharts.com/freecharts/candleglance.html?EEM,FXI,PGJ,HAO,RSX,AFK,FM,VNM,TUR,IFN,TTF,idx|B|P5,3,3|0
 http://stockcharts.com/freecharts/candleglance.html?SPY,RSP,PRF,XOM,GE,WFC,MSFT,CVX,JPM,googl,brk/b|B|P5,3,3|0
http://stockcharts.com/freecharts/candleglance.html?tan,scty,fslr,enph,spwr,slx,kol,x,aks,mtl,mt,crs|B|P5,3,3|0
http://stockcharts.com/freecharts/candleglance.html?AMLP,XLU,FIUIX,IYR,REM,PSP,LYSDY,HEMP,MJNA,MDBX,CBIS,GWPH|B|P5,3,3|0
http://stockcharts.com/freecharts/candleglance.html?SLV,CEF,GDX,SIL,PPP,AG,RGLD,FNV,SPPP,COPX,SCCO,FCX|B|P5,3,3|0

These where hit very hard during March-April sell off. 3D and pawn-shops are of interest to me.
 http://stockcharts.com/freecharts/candleglance.html?DDD,SSYS,ONVO,EZPW,FCFS,CSH,YELP,FEYE,SPLK,WDAY,CACQ,MPEL|B|P5,3,3|0

More here: http://ibergamot.blogspot.com/2014/04/digging.html
-------------------------------------------------------

Monday, June 9, 2014

Correct!

After all perturbations of March and April, and getting a brief reset in May due to sickness, I am enjoying a view from the top of rising Bull Wave.

I actually hit AUM low point in early May. Positions I was carrying  in April didn't respond well to earnings. I was stopped out of almost everything with small gains and losses. System 12 was a saving grace, performing much better than in any tests. Luck favors prepared. As I was Digging around (post-link) and reviewing old lists, new scans and my own sanity, I slowly put BCM account back on full margin after being sick in a Box (post-link). Right on time for a late May rip. I haven't made any new purchases in days, sold a couple of things along the way, and now just trailing stops. All positions are in profit, except PPP (-2%). Some met early targets, all have more higher targets ahead... just need to survive a shake-out...
http://stockcharts.com/freecharts/candleglance.html?geo,ppp,sea,fxi,rsx,dhi|B|P5,3,3|0

Last time I looked at SPX prospects was during Fishing Expedition (post-link) in March'14,  correctly analyzed but poorly executed attempt to pick a minor bottom. I wrote:
Fib target ... is 1898. My point-n-figure targets are 1974-1978, followed by 2115 (what?)... Lets first get to 1890, then we will see.
1897.28 happen right on a day of Bloodbath 1% of ATFH (post-link), all part of 50 Day Box (post-link).
I didn't pick the bottom. Fishing Expedition costed me a bit over 10%. Rotation out of prior market leaders, small caps and Bloodbath showed another 10% of losses. Helluva way to start a business, thou kinda typical for me. Every new endeavor of mine always had a rocky beginning.

I made some important changes while Sitting on a Fence (post-link) in late March, ordered myself to Charlie Mike (post-link) in early April, continued Digging (post-link) despite early setbacks, and now I see the fruits of my labor. Correct!

As SPX approaches my initial PF Targets of 1975ish, I astonishingly note that they been adjusted even higher, to well over 2000! In fact the closest target is 2023, followed by 2125ish and 2200 (what? what?!!). There are also Measured Move (MM) targets - one met, another one at 1975 again.
-----------------------------------------

Important observation is low volume on this rally. I heard and read several analysis of how this is a warning sign. True- 70's, 80's and even 90's bull advances where traditionally accompanied by higher volume, illustrating increasing interest and activity. Last 10 years show nothing of a kind. Up markets of late have been characterized by relatively low volume, diminishing every year. High volume days are mostly exhaustion and marks the top. What really happens is summer market started a week before Memorial Day. Volume and activity until 11-12ish, followed by mostly sideways on no volume at-all, and flat overnight. Very low VIX and plenty of shorts to squeeze in most hated bull market in history. How long it lasts? Until it doesn't.

ES expiration is less then 2 weeks away (on 20th). Its very similar to last one (here), in a way of Open Interest (OI) too high at over 3mil cars. Ones again shorts are caught overexposed and running out of time. Fortunately it doesn't matter to me, as I am fully invested and looking to take profits on trailing stops in BCM account. System 9 is a different story, as it holds more positions in diversified portfolio.

-----------------------------------------
There are no important news I am aware of.
-----------------------------------------
Solar activity is very low. Geomagnetic had been quiet for weeks (may be months), until lonely storm couple of days ago.
----------------------------------------
I have a T running out in June, Bradley top date in July, MADI too high for its own good, Golden Indicator still pointing up and no Confidence (via CI) to speak of. I'd like to see this rally run its course and review internal indicators then. Wondering if there is any Astrological thingamabob sometimes soon... Is there such a thing as Bear Market, or is it just an old wife tales?.. Buckwheats...

Wednesday, June 4, 2014

Homie Hopper

Somehow I got dragged into (very strong) Home Builders Theme (label XHB), may be because of indifference to all matters real-estate I see everywhere. May be because I actually see new developments by many of companies from these lists. May be because I actually use many products myself.
For a past couple of years, most of my interest was inside this old
 Very strong housing and real estate sector list:
http://stockcharts.com/freecharts/candleglance.html?$SPX,FSHOX,XHB,ITB,IYR,VNQ,ICF,RWX,RWO,DRV,SRS|B|P5,3,3
I traded XHB and mut fund back in 2012 and beginning of 2013, followed by a nasty sideways-to-down period I was lucky to sidestep. Several short REIT's trades (via SRS) ended in overall profit in 2013. Real Estate decidedly recovered, and I'm long IYR in LB account since April 2014. Would love an opportunity to switch to REM, like I noticed here (link), but why 'fix it, if it's not broken'?

Home Builder stocks don't look too hot, ignored or dismissed by media, display absurd valuations and high short interest. After choppy 2013, its not going to take a lot to send them 10-20% up, while support is well defined and only few percent away. The best thing about it is - whole bunch of them are correlated, so I can hop from one to another in BCM account without worry about wash sales. XHB will go into LB account on any entry signal. If Homies really bottomed, if this overlapping sloppy mess since February top was only a correction, if this economy worth anything at all - then XHB shall leave its 200day MA and depart north...and soon...
Here are Home Builders: (I like XHB thru TOL)
http://stockcharts.com/freecharts/candleglance.html?XHB,LEN,DHI,PHM,TOL,NVR,TMHC,SPF,RYL,MTH,KBH,MDC|D|J[XHB]|0
http://stockcharts.com/freecharts/candleglance.html?gfa,hov,mho,bzh,tph,avhi,xin,nwhm,ucp|D|J[XHB]|0

Building Materials are a large group themselves. Here are profitable ones, with billion-dollar companies on a bottom! High P/E's here attracted some short interest. Charts worth watching, can break either way
http://stockcharts.com/freecharts/candleglance.html?VMC,MAS,MLM,OC,USG,AWI,BECN,CSTE,AAON,TREX,UFPI,HW|B|P5,3,3|0
Then there are assorted odds-n-ends:
Retailers, Wholesaler LPX, bunch of lumber companies in disarray, lonely manufactured housing CVCO, and cement
http://stockcharts.com/freecharts/candleglance.html?HD,LOW,LL,SHW,LPX,CVCO,WY,PCL,RYN,PCH,EXP,TXI|B|P5,3,3|0
There is also Property Management, that is also very strong, I'm just not sure what it is...

Steve Eisman of 'Big Short' fame was talking about Homie's boom at recent investment conference
He's got builders, land, financials and may-be more
http://stockcharts.com/freecharts/candleglance.html?len,phm,for,clny,ocn|B|P5,3,3|0

Lets say I'll see about these for Homie Hopper 2014:
http://stockcharts.com/freecharts/candleglance.html?XHB,LEN,DHI,PHM,TOL,WY,PCL,RYN,PCH,EXP,TXI,mlm|B|P5,3,3|0

Thursday, May 8, 2014

50 Days Box

.......developing.......


I've been sick for over two weeks, just managing positions, reducing, avoiding whipsaw.
We have been in this S&P500 Box for over 50 days, seemingly trying to break the top, but unable to. May-be any minute now, maybe later... Bradley low is now, to be followed by up to 7/16/2014. Small caps are in a world of hurt, in their own bear market or just a correction. Treasuries are a place to be, I bought and added once in System1 account back in    .

chart SPX
chart IWM

BCM and LB accounts are fluctuating in 1% range. I don't know where we going. Internet is dead, bloggers don't post much, commenter are all gone. Not that I am reading too much - mostly skimming pages ones in a while.  Cobra had 50 people today in a room - he used to had hundreds! What is this dead summer market? Did everybody already blow up? My accounts are light - LB over 30% cash; BCM off the margin. I don't see a lot to buy. Either too late, or too beat up , or may be i am in a wrong stocks... I wasn't in a condition to do too much anyway.

Being sick in a Box gave me some time to think about System1, that had been frozen since 2013 with only   Wellesly Fund on. I promised myself to never sell it, just add or reduce. In fact, I bought it in 2008, added once in 2009, then took some off, and never touched it since. I look at it ones in a while, just to see if I can add a half position or so, but its always too late... One of my best performers ever!

The complete sell off of System1 during Spring and Summer 2013 was based on very vague exit concept, that effectively ruined my performance last year. System1 served me well, it always managed to step aside in bear market and participate in bull market, it never had a loosing year. Exuberant risk avoidance inevitably leads to excessive protection of gains, and is a major drawback  to my long term performance. This old and true system was developed even before I new about systems, or their management or mostly everything I know now. Simplicity of System1 needs to be preserved, but for everything else I need something better. I need a new System 14, to stay invested in long weekly-monthly trends, rotating thru major asset classes in Vanguard account via mutual funds only. It has to be rule based, with simple set of risk controls and filters, diversified and ranked (somehow)

------------------------------------------
of TopStep reflecting on organized destruction of financial industry, a recurring theme of mine.
...I have pointed out how there were over 500 clearing firms between the CME and the CBOT and that today there are only 40 clearing firms of which only 10 can do a small account... It really doesn’t matter if the markets go up or down, with the volumes as low as they are many of the big banks and brokerage firms that made up our industry are either closed due to new regulations or just not trading...
 http://mrtopstep.com/financial-banking-sector-stocks-breaking/
I don't think it doesn't matter. I don't think that volume is liquidity. I don't think its a good...
------------------------------------------