Daily Global Economic Calendar

Real Time Economic Calendar provided by Investing.com.

Thursday, May 8, 2014

50 Days Box

.......developing.......


I've been sick for over two weeks, just managing positions, reducing, avoiding whipsaw.
We have been in this S&P500 Box for over 50 days, seemingly trying to break the top, but unable to. May-be any minute now, maybe later... Bradley low is now, to be followed by up to 7/16/2014. Small caps are in a world of hurt, in their own bear market or just a correction. Treasuries are a place to be, I bought and added once in System1 account back in    .

chart SPX
chart IWM

BCM and LB accounts are fluctuating in 1% range. I don't know where we going. Internet is dead, bloggers don't post much, commenter are all gone. Not that I am reading too much - mostly skimming pages ones in a while.  Cobra had 50 people today in a room - he used to had hundreds! What is this dead summer market? Did everybody already blow up? My accounts are light - LB over 30% cash; BCM off the margin. I don't see a lot to buy. Either too late, or too beat up , or may be i am in a wrong stocks... I wasn't in a condition to do too much anyway.

Being sick in a Box gave me some time to think about System1, that had been frozen since 2013 with only   Wellesly Fund on. I promised myself to never sell it, just add or reduce. In fact, I bought it in 2008, added once in 2009, then took some off, and never touched it since. I look at it ones in a while, just to see if I can add a half position or so, but its always too late... One of my best performers ever!

The complete sell off of System1 during Spring and Summer 2013 was based on very vague exit concept, that effectively ruined my performance last year. System1 served me well, it always managed to step aside in bear market and participate in bull market, it never had a loosing year. Exuberant risk avoidance inevitably leads to excessive protection of gains, and is a major drawback  to my long term performance. This old and true system was developed even before I new about systems, or their management or mostly everything I know now. Simplicity of System1 needs to be preserved, but for everything else I need something better. I need a new System 14, to stay invested in long weekly-monthly trends, rotating thru major asset classes in Vanguard account via mutual funds only. It has to be rule based, with simple set of risk controls and filters, diversified and ranked (somehow)

------------------------------------------
of TopStep reflecting on organized destruction of financial industry, a recurring theme of mine.
...I have pointed out how there were over 500 clearing firms between the CME and the CBOT and that today there are only 40 clearing firms of which only 10 can do a small account... It really doesn’t matter if the markets go up or down, with the volumes as low as they are many of the big banks and brokerage firms that made up our industry are either closed due to new regulations or just not trading...
 http://mrtopstep.com/financial-banking-sector-stocks-breaking/
I don't think it doesn't matter. I don't think that volume is liquidity. I don't think its a good...
------------------------------------------

Thursday, April 17, 2014

System 12 - Q1

Note: this update covers all activity from 4/17/2014 to 6/17/2014. May update was skipped, because there where no changes to MD, and nothing piqued my interest at that time.

System 12 BCM:
http://stockcharts.com/freecharts/candleglance.html?WFC,RDS/B,NVS,MSFT,JPM,JNJ,BRK/B,IBM,GE,PG,WMT,xom|B|P5,3,3

Unfortunately LP didn't last long. Hoping that earnings will be well received, so S12 can increase allocation. LP is the key ingredient for growth.
1st Quarter 2014 earnings score
(only initial reaction considered, regardless if stock recovers or not):
All reported:  6 up; 6 down
Note on JPM - exit criteria was met, but stock stabilized and did not take out PP low. In by-pass with trailing stop-loss.
AAPL split 7:1 on 6/9.

SLD: JPM on 5/5; MSFT and IBM on 5/6; WMT on 5/20; PG on 6/4
BOT: CVX and PTR on 5/7; MSFT and AAPL on 5/12 (re-entry); GOOGL on 6/3
DIVI received: JPM, PG, WFC, WMT, JNJ, XOM, CVX, MSFT.

CHL, T, TM, BHP, ORCL


This is MD:
http://stockcharts.com/freecharts/candleglance.html?AAPL,XOM,GOOGL,MSFT,BRK/B,GE,JNJ,WMT,WFC,RDS/B,CVX,NVS|B|P5,3,3

MD Control: JPM, PTR out;  CVX, NVS in.
All qualified.
I don't have AAPL, GOOGL, CVX
RDS  not sure when earnings. Year end in Dec., results published in March?
BRK earn. in early May?

This is SD:
http://stockcharts.com/freecharts/candleglance.html?PTR,PG,JPM,IBM,HSBC,VZ,PFE,CHL,T,TM,BHP,ORCL|B|P5,3,3
BAC out, VZ in
I have PG, IBM, JPM

This is Arnott Overlay (AO):
 XOM, GE, WFC, MSFT, CVX for 20% each. JPM pending resolution of earnings gap-down.
http://stockcharts.com/freecharts/candleglance.html?SPY,RSP,PRF,XOM,GE,WFC,MSFT,CVX,JPM|B|P5,3,3

------------------------------------------------------------
Clever Eddy Elfenbein made an interesting observation here:
http://www.crossingwallstreet.com/archives/2014/04/the-markets-oligarchy.html
...market cap of the S&P 100 makes up about 62% of the market cap of the S&P 500...The S&P 500 makes up about 77% of the entire value of the Wilshire 5000. Despite its name, that index has 3,663 stocks... S&P 100 is about half of the Wilshire 5000. The remaining 3,563 make up the other half.
That goes to a core of System 12. Combined market cap of MD Control (index) is something over 3.5 Trillion Dollars. Imagine, if Mega Dozen was a country - it would be 4th or 5th biggest economy in a World!
Extremistan, USA (Taleb, yes)

Monday, April 14, 2014

Digging


If you find yourself in a hole the first thing to do is stop digging...

My hole isn't really that big. I've been in much deeper holes, came out ahead and advanced. I'll just keep on digging a little while longer, feeling around for different directions, adjustments, improvements. It takes me almost 2 months to find my bearings here. In isolation. With colossal constructions next door for a first 3 weeks. With massive roof leak (now completely fixed), and most miserable winter I've seen in 20 years. With constantly breaking old car, finally giving up in a middle of highway, in a dark, with kids in a back (I love my new Elantra 30mpg). With me unleashing a short-term ES trading system, and seeing it clown-rape my account. Surprise tax bill. And no cash. I am ready for summer.

This business is trying and taxing, and wears out its participants to ashes. The ones who remain standing and sensibly functioning will make it out. Everybody else are blowing up in massive swings. I reviewed many familiar blogs and forums. Places are incredibly busy, everybody are bearish as shit. Almost like good old days of financial crisis. Except indexes are few percent from all time highs, and most of my stocks are ok, with little damage. We can chop like this for a while.

-------------------------------------------------------
This poor soul lost 195K in 10 days, from January 31 to February 17 this year. I believe its completely true, I believe its a very common experience by now across investment landscape. This is exactly how clean up happens, and by the looks of it, its not over. I know, I've been there... '2010 Disaster'...
http://trainwrecktrader.wordpress.com/
 "Good judgment comes from experience, and a lot of that comes from bad judgment", said the same Old Cowboy.
------------------------------------------------------

Earnings season is here.
If I had any short term swing positions, I would drop them before earnings. I have none.
This is BCM, I want to keep every single one of them thru earnings, unless sudden collapse, crush or snow. How else do I realize long-term gains? Expectations adjustment (both ways) happens most often on earnings release.
LO is first on 4/24.
http://stockcharts.com/freecharts/candleglance.html?LO,WDC,GEO,CCJ,FXI,GDX,VNM,CHKP,FSLR|B|P5,3,3

As for new positions, I am extremely risk averse, would rather not buy anything before earnings, or at least see how related  stocks react to announcements.
The strongest sectors seems to be Energy, Staples and Utilities.
The most damaged are Health Care (thru biotech, no doubt) and Cyclicals(?);
Financials looks ominous.
Solar activity is moderate, but with unusually many geomag storms. Lunar eclipse, followed by solar eclipse on 4/28, with Cardinal Cross in between (some kind of unusual planet alignment thingamabob). Passover and Easter are together this year. I got my tin hat on...
Time to plant the garden and sow the seeds...he-he

----------------------------------------------------
This is Arnott Overlay (AO).
Based on strategy cross-selection, these are the best stocks ever. I want to own them in System9, but technical's are discouraging for all. Looking for entry.
http://stockcharts.com/freecharts/candleglance.html?SPY,RSP,PRF,XOM,GE,WFC,MSFT,JPM|B|P5,3,3
----------------------------------------------------

There is a clever  Eddy Elfenbein of CrossingWallStreet, proclaimed a 'best buy-and-hold blogger', with his Buy List. A collection of 20 stocks, set in a beginning of the year. He mentioned that not all should be held continuously. This fits with my efforts to trade opportunistically the very best, sound businesses. This gig is hard enough, I need all the tilt I can get. Still I give only limited weight to fundamental factors - this is a game of speculation, not accounting.
http://www.crossingwallstreet.com/
Eddy Elfenbein Buy List (EEBL) with equal continuous allocation (like index...he-he) beat S&P500 every year since 2006. I like his picks, good mix. Some familiar faces - IBM, MSFT, WFC from S12BCM, notable is ORCL here again (fresh one in SD from last month).
Well done, Eddy! Thanks
http://stockcharts.com/freecharts/candleglance.html?$SPX,IWM,VTV,VUG,AFL,BBBY,CA,CTSH,BCR,DTV,EBAY,ESRX|B|P5,3,3
http://stockcharts.com/freecharts/candleglance.html?FISV,F,IBM,MCD,MDT,MSFT,MOG/A,ORCL,QCOM,ROST,SYK,WFC|B|P5,3,3

After removing what I already have, these seems the best now, but I am just watching how they all react to earnings:
http://stockcharts.com/freecharts/candleglance.html?AFL,CA,CTSH,DTV,EBAY,ESRX,F,MCD,QCOM,ROST|B|P5,3,3
-----------------------------------------------------

While on a subject of 'buy-n-hold' and fundamental analysis,  how can I forget Old Man Buffet. Here is his top 2 dozen as of end 2013, from WFC 20% to MTB at 0.5% of portfolio:
http://stockcharts.com/freecharts/candleglance.html?WFC,KO,AXP,IBM,PG,XOM,WMT,USB,DTV,DVA,GS,PSX|B|P5,3,3
http://stockcharts.com/freecharts/candleglance.html?MCO,GM,GHC,USG,BK,CBI,COP,LMCA,NOV,VIA,VRSN,MTB|B|P5,3,3
Notable that BAC is not here, but actually its his 5th largest position (thru warrants and shit...).

--------------------------------------------------------
Emerging Markets are going apeshit to upside, against a backdrop of extremely negative news. Action is really all over the world - Asia-Pacific (GMF), Africa and ME (GAF), Latin America (GML) in a big way. All this is not really visible in EEM, maybe due to China, and especially Russia. I've been shuffling some etf's around, here is more:
http://stockcharts.com/freecharts/candleglance.html?EEM,GAF,GML,GMF,AFK,FXI,PGJ,VNM,TUR,RSX,IFN,EWZ|B|P5,3,3
GAF, GML, GMF are really non-tradable, but here is more...dip would be nice:
http://stockcharts.com/freecharts/candleglance.html?fm,ews,idx,eww,eza|B|P5,3,3

Mother Russia is up to no good. Sentiment is extremely negative. Even russian analysts bear-shitting all over their markets for next 2 weeks. Ivan's got it all figured out, they know every move over coming days.
Will Влади́мир Влади́мирович deliver?
http://stockcharts.com/freecharts/candleglance.html?$RTSI,RSX,CTCM,MBT,MTL,QIWI,VIP,YNDX,OGZPY,SBRCY,NILSY|B|P5,3,3
------------------------------------------------------

 These where found in a different way. Instead of working from theme to chart, or relying on somebody's fundamental research,  I made several scans in Finviz based on certain fundamental and technical criteria.
2 weeks ago, as I ordered myself to Charlie Mike (link), I came up with this:
http://stockcharts.com/freecharts/candleglance.html?WDC,XEC,GD,RTN,XLNX,DIS,VLO,INTU,UNP,LLY,PSX,MXIM|B|P14,3,3
The only entry I took is WDC, but almost all are still ok. Notable here is PSX - one of RAFI top stocks.
I am still tuning this thing, its coming up with some familiar names, oils, HUM, ALL and BWA - auto part factory in Michigan with 20K! employees.

Methinks, I dug up enough for now...


Sunday, April 13, 2014

System 12 - Arnott Overlay

There is very smart Robert Arnott of Research Affiliates, who made up a bunch of indexes based on fundamental weight. Key criteria (sales, cash flow, dividends and book value) are sliced and diced in order to get weightings for a variety of indexes in US and abroad.
http://www.researchaffiliates.com/Pages/home.aspx
 RAFI Fundamental Index equity strategies select and weight securities by their fundamental measures of size
Some indexes and weights are here:
http://www.ftse.com/Indices/FTSE_RAFI_Index_Series/index.jsp
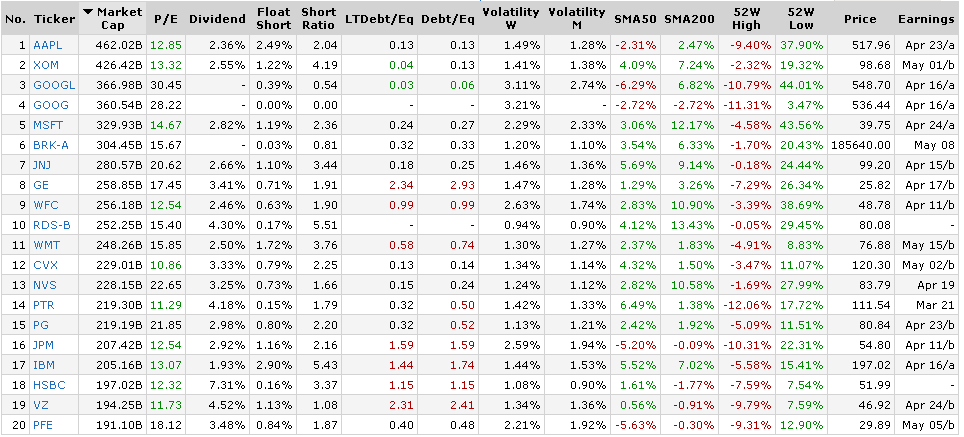
When I looked inside  RAFI US 1000 index, I found most of System12 stocks in top two dozens.

(Note: most resent weighting for corresponding etf  PRF from PowerShares are here
https://www.invesco.com/portal/site/us/investors/etfs/product-detail?productId=PRF)

Size matter... in everything... I know... and also from personal experience... I got size... I know...
But really, what matters as size, as far as companies go? Sales matter (otherwise there is no E in P/E), dividends matter (otherwise nobody gets paid to wait), book (otherwise its just an air)..., if we are talking about true market leaders, corporations that really control this shit and make themselves laws to suit. These names are the biggest and the best, around us everywhere all the time in everything, laying off the vig 24/7 worldwide!

Here in order of index weight, as of 12/31/2013
from largest XOM at  2.87% to BRK at 0.61%, in total a bit over 30%
http://stockcharts.com/freecharts/candleglance.html?XOM,BAC,GE,JPM,CVX,T,C,WFC,COP,PFE,VZ,MSFT|B
http://stockcharts.com/freecharts/candleglance.html?JNJ,PG,WMT,AAPL,INTC,HP,AIG,MRK,F,IBM,PSX,BRK/B|B

The idea is this:
What if I take 1 standard System12 position size, and divide it between Mega Dozen (MD) components in a way of 'Fundamental Bonus'. Only top 12 of RAFI stocks are considered.  5 of them were in MD in January, 2014 - XOM, GE, CVX, WFC, MSFT, then CVX was removed in February, then JPM was added in March. Increase in position size of these in MD Control equally by 20% each shows almost same result, with no material improvement. Testing 3 months period is meaningless for S12, but I am not going to back test. I want to observe this in real time, and especially now, when nothing else works.

It may be possible to skew selection process towards higher ranking in RAFI, by allocating 50% of total bonus to top 2 stocks. The rest will have to share remaining half, also in unequal parts, with lowest being 10% of total bonus. But this may be premature, as I don't have enough data. Also I want to wait for Arnott's own re-balancing, and see how recent earnings affect index weightings. They publish updates with lag of at-least 2 months, so I will not know for a while.

In real world I don't trade MD Control (its just an index...he-he), so here is a true back-test.
Using actual account records, starting 1/28/2014, apply Arnott Overlay (AO):
Apply 20% bonus to S12 position, that is in MD and also one of top 12 in RAFI allocation. (This percentage will change in time, depending on amount of matching stocks of  his first dozen and mine.)
No re-balancing of existing positions. System goes into LP much sooner.
Slightly positive results achieved.
NOTE: this is an extremely short time period for definite conclusion
I tried several different ways to split this bonus, and also tried to include SD stocks. All tests have a slightly better tilt, than actual account records. This leads me to believe, that Mr. Arnott's method has merit, statically robust and will add a bit of 'Smart Beta' to System 12 portfolio.
Who said fundamentals don't matter?
Thanks, Rob

There is an additional use of  AO, as a qualifier.
I had this problem in back-testing, when there are several candidates from SD for non-fully-loaded System12. All looked equally good on a chart, and I basically went on a coin flip. Now I can use RAFI as a ranking tool, giving preference to entry into higher weighted one. Anything that eliminates my own discretion is good for S12BCM.

Every single AO component already is an existing position of S12BCM
I am not going to adjust my positions here, because costs will effectively eliminate any gains.
Going forward, AO will be updated at every roll-over, and also as soon as current RAFI allocation is published.
MD Control will not be changed, and will continue to be calculated based on original methodology. Its my index, the least I can do is to preserve its integrity. No scam here. Really

As of 4/13/2014, Arnott Overlay (AO) are:
XOM, GE, WFC, MSFT, JPM for 20% each
http://stockcharts.com/freecharts/candleglance.html?spy,rsp,prf,XOM,GE,WFC,MSFT,JPM|B|P5,3,3

------------------------------------------------------
 Research Affiliates Chairman and CEO Robert Arnott explains why fundamentals can make a big difference on Wealthtrack with Consuelo Mack
http://wealthtrack.com/recent-programs/robert-arnott/
 http://www.kingworldnews.com/kingworldnews/Broadcast/Entries/2014/3/29_Rob_Arnott.html
http://www.kingworldnews.com/kingworldnews/Broadcast/Entries/2014/1/15_Rob_Arnott.html
http://www.kingworldnews.com/kingworldnews/Broadcast/Entries/2013/10/17_Rob_Arnott.html
more there
------------------------------------------------------

Tuesday, April 8, 2014

Not-So-High High Yield

I always try to keep some high yield dividend paying component in System9 account.Stocks are usually no good, as there are many scams. The rest is a bunch of mortgage reit's, oil trusts,  etc that pay for months, but then suddenly drop 30-50% in a day. Then there are telecoms..., but I already have them in mut fund. So an idea is to stay with liquid names, etf's with low(er) expense ratio, but with a hand on ejection button.

I have utilities fund, AMLP, IYR
http://stockcharts.com/freecharts/candleglance.html?AMLP,FIUIX,IYR,PSP,REM,HYLD,SDIV,dvy,HYG,JNK,LQD,PCY|B|P5,3,3

PSP is Listed Private Equity from PowerShares. Exp over 2%. Yield 13% paid quarterly.
REM is residential and commercial mortgages from iShares. Exp under 0.5%. 36 holdings. 10-15% quart.
IYR is real estate stocks and reit's. Same expense, but only 4% yield quarterly.
HYLD is actively managed corporate junk bonds from AdvisorShares. Exp 1.25%. Yield 8% monthly.
SDIV is dividend stocks from GlobalX. Exp 0.58%; yield 6%

Thinking about switching from IYR to REM, and add PSP
but softly. My schemes have been blowing up lately

Sunday, April 6, 2014

What's Up


------------------Internals Update-----------------------
Surprisingly, internals don't offer much insight into presently potentially dangerous situation.
Over 70% of S&P500 stocks are still bullish and above 50dma. It doesn't tell the future, only present conditions.
MADI is still above 0, while Nasdaq A/D indicator is much weaker and already  spent some time below 0 in March. Confidence Indicators are just in a sideways noise. Golden Indicator is surprising - it was advancing strongly in second half of March, I am really curious at what it will do next. SPX under-performing the world and especially Emerging, but it doesn't last long in recent months.
-----------------------------------------------------------

It strongly feels to me that market is falling apart, everything will get hit, leading to much-much lower levels on popular indexes. Small caps (via IWM) and Nasdaq stocks in general are weaker than large caps, represented by Dow and S&P, but I want to focus on S&P500 for several reasons.

I studied major averages going back over 100 years. There is no dependable set of rules that would enable a person to ride every zig and zag. On a top of that they keep changing the rules of how indexes composed and calculated. That cockamamie S&P500 index is calculated based on publicly available float, which is misleading number, and then there is a divisor (o, statistics). Historically index moves up and down 10 to 30 percent at a clip without rhyme or reason, and can go for over 20 years in a wide range without any noticeable progress or just rip endlessly higher for years. We seemed to be in a former up until last year. As I pointed out back in early 2013 (link): "Sure, we can learn from history, but not as much as you think."

There is an unusual divergence in performance of growth VUG vs value VTG stocks, over a recent couple of months. Value out-performance is uncommon, as growth stocks are market leaders most of the time. So much so that 90's crazy bull market was all growth, while value was killed and many good companies in their own mini-bear market, even with averages ripping higher.

Lets assume for a second that miscreants from McGraw Hill are actually doing a good job (for index that is) and that ,based on Dow Paradox (link), "The purposeful manipulation of index components is designed to produce positive outcome, thus creating an upward equity slope". Then it would be possible to find good, profitable, growing companies, that are also in up-trend, among S&P 500 index components. These type of stocks should be something similar to System12 components, as this is how a company becomes one of Mega Dozen (MD) - grow to become The Biggest. The bottom of the barrel should be exactly the opposite - a prime candidate for short before these lagging dullards are dropped from index (and especially after).

OTOH, I am looking for new emerging Theme, not based on my own opinion (which is usually correct, but badly timed), but on price action and fundamentals of present market leaders. The trick is to find a Theme that is emerging from years/months of basing, so I can 'buy low - sell high'; and at the same time the one that is already moving on daily/weekly, so I can 'buy high - sell higher'. This is an epitome of System9.

---------------------------In The News----------------------------
The biggest unreported news is a string of at-least 12 suicides of high level financial services executives around the globe. Tragic and not comical at-all, the story is custom made to fit any popular conspiracy theory. I wonder why nobody seems to step forward?
http://www.zerohedge.com/news/2014-04-05/abn-amro-ex-ceo-found-dead
JP Morgan, Deutsche Bank, Swiss Re, ABN Amro etc. Clean-up or damage control...he-he

Friday, April 4, 2014

Bloodbath 1% off ATFH

I have to write this in order to stop myself from selling every stock I have.

I mere 1% off All Time Fucking High (ATFH), which was printed today - its a bloodbath!
I can't understand how there is so much damage across the tape over past month and espessially today. All thru March we had a crush (or at-least a mini-bear market) in all momentum names, prior market leaders or just any damn stock that was up. System9 had few of them (now all out) and was buying some others, but its almost impossible to hold anything for more than a couple of days, even with wider stops. Turnover in System9 account is tremendous, going from 30%cash to 5%cash to back over 30% in a span of less than 1 month. Now THAT never happened to me before!

Only respite was a big, liquid mega-cap stocks - under premise that this is the only place to park money. As chance would have it - exactly the kind of stocks that picked by System12. Good for me, no question about it. Obviously I took much more losses elsewhere, and I wasn't even heavily into these momentum hand-grenades. Sure, I tried FEYE at what seemed like support, but was stopped out. Then SCTY, SWI twice - couple of percent loss each time. Then ag stocks went, followed by WDC, sector etf's etc. Now that is too much - good quality institutional names are falling like its a bear market. Not even a bounce during a day.

 What a hell is going on?
I doubt I will find an answers on time. Only price pays, and it hasn't paid in weeks. I got my low risk entry point, that is defined by a stop. The stop hits and I am out. Small pain, so I can preserve my money for large gain. Except there is only so much of many, many small pains I can take. Of 14 positions I entered during previous and this week, only 4 survived (and one of them only by a smidge). Even some System12 stocks made me think about Emergency Exit (EE), I even put 2 stop-loss orders during the day, but then cancelled them. EE is a drastic measure, although vaguely defined, there should not be any doubt about its necessity and urgency, which is a whole point of EE.

We opened strongly off some BS news, SPX went up like 7, but collapsed an hour later. SPX -23 on a close doesn't even tell the whole story. Nasdaq is -110, as this is where the most carnage happened. Most of my stocks (like 8 out of 10) are not even Nasdaq listed, still only 4 are green in BCM account (LO, CCJ, JNJ, RDS). System9 account was supported by miners, IYR, utilities and few other things, but it wasn't nearly enough to cushion the blow.


Tuesday, April 1, 2014

Charlie Mike

From UrbanDictionary:
 It Means Continue Mission. Usually said after an interruption or hiccup in whatever you're doing. This phrase is derived using the phonetic alphabet (Military Alphabet).
And more:
           Whether you’re about to jump from an airplane, dive from a boat or assault a target – CHARLIE MIKE is all about making the mission happen – it’s about Never Giving Up until you have completed the mission and hearing the words MIKE CHARLIE: Mission Complete.
------------------------------------------------------------------------------------
http://stockcharts.com/freecharts/candleglance.html?JJG,MOO,MON,ADM,POT,HRL,TSCO,LNN,SEA,KEX,NM,TK|B|P5,3,3
http://stockcharts.com/freecharts/candleglance.html?HEMP,PHOT,MJNA,MDBX,AG,CEF,FNV,GDX,PPP,RGLD,SLV,SPPP|B|P5,3,3
 http://stockcharts.com/freecharts/candleglance.html?URA,CCJ,CVV,GTI,ENTG,TAN,SCTY,ENPH,fslr,IBB,BIS|B|P5,3,3
http://stockcharts.com/freecharts/candleglance.html?MHFI,GEO,DVA,SWI,LO,WDC,X,TUR,VNM,FXI,AFK,RSX|B|P5,3,3
http://stockcharts.com/freecharts/candleglance.html?AMLP,XLU,FIUIX,LYSDY,IGE,IYR,XHB,XRT,XLB,imax,fslr|B|P5,3,3
 http://stockcharts.com/freecharts/candleglance.html?CWEI,WTI,HK,NBR,PBR,SGY,STLD,MTL,AKS,MT,CRS,X|B|P5,3,3

These where found in a different way. Instead of working from theme to chart, I made several scans in Finviz based on certain fundamental and technical criteria. Not too many results, but they are pretty
http://stockcharts.com/freecharts/candleglance.html?WDC,XEC,GD,RTN,XLNX,DIS,VLO,INTU,UNP,LLY,PSX,MXIM|B|P14,3,3

These been hit very hard.
http://stockcharts.com/freecharts/candleglance.html?DDD,SSYS,ONVO,EZPW,FCFS,CSH,YELP,FEYE,SPLK,WDAY,CACQ,MPEL|B|P5,3,3

Some Theme changes and notes:
- In Agriculture I removed NIB and BAL, they don't move enough. Added couple stocks, but they all pretty well correlated.
- Shippers are not correlated very much, plus a big advance in $BDI from summer last year is almost gone.
- Precious Metals and miners reduced somewhat.
- Marijuana was reduced drastically on last rip. I added a little recently.
- Uranium is looking better than ever since Fukushima. Unfortunately, that industry was all destroyed, most stocks are in single digits.
- Graphite coming out of multi-year base. I'm buying dips in half positions. Miners are Canadian penny stocks - no go. My list is old - need to review.
- Solar. With all my great expectations for Solar industry, I never got around to making a list.

- Copper was all stopped out, no re-enrty, temp on hold

----------------------------IN THE NEWS---------------------------------
The biggest stir in a market (unbelievable) is actually Michael Lewis's new book "Flash Boys" about HFT and how "markets are rigged". Story will sell, politicians and FBI are involved, floor traders are shouting behind the scene - what a fucking circus.
Volume is not liquidity, you simple-minded scoundrels! High Frequency Traders (HFT) are not market-makers! Scalping doesn't make markets more efficient!
None of this even matter, but makes for exciting TV (they even held commercials for entire segment)

------------------------------------------------------------------------------

Whats really funny is none of it is new, and shills on a Tee-Vee has been in bed with these same fuckers since forever. Here is Cramer sweating bullets in 2009, admitting  that he is wrong as much as right (o, horror), that CEO's lie to him on his very show, that investors being sold down a river ... and this moron is still on boob-tube pimping same crap to new generation of suckers.

The real kicker thou is a ticker tape at 0:30. Here is SPX  70 points off the bottom @ 736; oil @ 45; ESLR @ 1.18... and they tell me that long-term investing has no merit, o, and somebody scalping a penny off the vig make any difference at all. How? Today SPX 1888; oil doubled, Gasoline tripled... they can have a damn penny. Evergreen Solar (ESLR) filed for bankruptcy in Massachusetts in 2011, moved to China, and now a billion dollars in sales private company.

As for me, I remember 2009 like it was yesterday. No, I wasn't buying SPX for a Thousand points gain in 5 years. I was scared that the sky is falling, watched CNBC 24/7, and was shorting everything via options. Nobody told me that I was 'over-thinking' back then...

http://thedailyshow.cc.com/videos/0vqrim/jim-cramer-pt--1
--------------------------------------------------------------------------------


----------------------------------------------
There is another book about HFT etc, I am actually more interested to read. In it there is a story about Thomas Peterffy of Interactive Brokers saying back in October 2010:
"Technology, market structure, and new products have evolved more quickly than our capacity to understand or control them. The result has been a series of crises over the past few years that have caused many investors to lose confidence or to think that the whole system is a rigged game."

Thursday, March 27, 2014

Sitting on the Fence

About a month into Bergamot Capital Management, I find myself with less capital and 'up the river without a paddle'. So following my wife's advise I stopped to look around.

My account isn't big, but it was suppose to be enough to produce about equal to my previous income. For that I had System 11 - a simple and robust approach to short term S&P 500 index trading. This system was well  thought out, thoroughly back-tested, paper traded, and then traded with leveraged ETF's. All good. Then I moved to ES futures, to get this thing making real money. For-awhile I was ahead, even though I traded it sporadically. Then about a month ago it pretty much stopped working. WTF? Upon reviewing recent trades I realized that I am badly over-trading. Usual remedy is to step out to larger time frame and avoid whipsaw, but it required larger stops... Too large, as it turned out. Combining Systems 10 and 11 seemed like a good idea, but was an unproven method, and backfired severely.

It is quite possible that System11 was based on that fucking pseudo-statistical TA mambo-jumbo nonsense. I see it alot around internets these days. Sound all fancy, with secret acronyms - TA gone mad! These squiggly-wiggly lines and exotic candle patterns on a chart suppose to tell a trader where to buy and sell, and it works every time, and there is a trade every day, and you just reverse if you are wrong, and you win more than you lose ... except when I do it. I guess I was suckered by some temporary irregularities into thinking I can game short term index movements. Lots of people do that, lots did it before them. No wonder all old posters and commenters are gone from most sites and forums I read. They all blown their accounts!

I took a day or two to poke around interwebs, and ask some people: "How come skillful and profitable stock trader is a complete sucker when it comes to index futures?" Nobody replied anything meaningful, but I read some stories very similar to mine. Especially this:
 Сегодня день меня уничтожил… Нет больше грааля, ничего больше нет… сливал как мог, за один день всю месячную прибыль, и дело не во мне, не в тильте, а в системе, которой больше нет, точнее она не работает. Видимо я просто попал в фазу рынка, где увидел какую то закономерность, но вот она и прошла.
Буду пытаться понять сам рынок, а не искать алгоритмы, которые сужают мое сознание до точки, и я просто напрсто перестаю думать. На данный момент имею 22 600р на счету и полностью чистый мозг.
Моя цель ПОЗИЦИОННЫЙ ТРЕЙДИНГ А НЕ ТУПОЙ СКАЛЬПИНГ! Значит, так, с завтрашнего дня буду выкладывать в блог каждый трейд и эквити счета.
Сейчас занимаюсь пониманием рынка)
Russian guy from SmartLab  http://smart-lab.ru/my/Viacheslav/blog/all/
Holly Shit, how come the guy I never knew, on the other side of the World, gone thru exactly the same experience I just did? I'll tell ya how... we are both Suckers... the only difference - I was suppose to know it already, based on Dow Paradox.(link)

According to my own real world experience - short term ES futures trading is a fool's errand.
After all, index was made exactly to avoid any necessity of short term trading, smooth out irregularities, reduce risk, etc. Instead they turned it into horse-n-pony show, because it benefits Scammers. Brokers make money, pumpers make fee's, advisers charge for 'forecast' - all happily paid for by willing Victims, who don't want to make things too complicated, but rather just trade this one thing (sarc). How can Technical Analysis (TA) be used to analyze past price and volume of index, when there are no buyers and sellers, but only Scammers and Victims... and Suckers blood to keep them going...

To make sure I am not a Victim, I stopped doing few things:
1) No more day-trading (final decision)
2) No more futures (unless its an overnight emergency hedge)
3) No watching news (I've been staying away from TV for-awhile. It did me good)
4) No more reading or posting on any trading blogs! NONE! I will not let somebody's nonsense to get into my mind again. I have been learning and studying, and reading so much about the market over past few years. I think I've learned everything there is to know. I even know stuff that is not written anywhere,... ever. In fact, I know so much - I can teach other people about this shit. But I will not.
5) I refuse to become a Scammer.

My biggest and most consistent gains came not from trading stock market, but from researching market of stocks. I am always looking for some kind of companies or industries that make sense, make money, have bright future, and (if I am lucky) carry discounted expectations. When forecasting error is realized and expectations are adjusted, then valuations of company undergo rapid repricing, allowing me to sell to a greater fool. Prudent speculator gets in early enough to accrue easy gains, before Scammers get a whiff of whats going on and crap all over a good thing. The biggest trick is to find and enter these stocks on time. Get in too early - too long ride; get in too late - stop too wide.

I have found, and invested, and traded, and made alot of money in stocks like that.
This is the only way I know of  How Not To Be a Sucker.
I got this thing licked


---------------------------------------------------------
http://stockcharts.com/freecharts/candleglance.html?WDC,XEC,GD,RTN,XLNX,DIS,VLO,INTU,UNP,LLY,PSX,MXIM|B|P14,3,3

Tuesday, March 25, 2014

System 12 - Fully Loaded


  "There are three kinds of lies: lies, damned lies, and statistics." Mark Twain

"I can massage data so well - you will think I have two dicks. But in reality, I am just a pussy"  iBergamot

Pseudo-statistics. What a beautiful little concept to sell endless trading systems and methods to muppets. Doesn't work for you? O, its just human nature - you are a flawed mother-fucker. And lazy too... didn't do proper testing. Testing... TESTING... Why are you people testing random shit? Why is this kind of candle-stick after that kind of a stick, so many sticks from some other fucking stick should mean anything to stick +1? These people are mad scientists. No wonder they always seems to blow up. Some system...

Index. I have an INDEX!  Mega Dozen (MD) is essentially an index of very best, biggest, most liquid, multinational, profitable, dividend paying corporations. Not my opinion. Market voted, I just added some filters and guidelines. No manipulation here, no scam, no agenda. My System 12 is not some cockamamie  index of stocks - its a collection of the best companies money can buy. Really
--------------------------------------------------------------

System 12 BCM:
http://stockcharts.com/freecharts/candleglance.html?WFC,RDS/B,NVS,MSFT,JPM,JNJ,BRK/B,IBM,GE,PG,WMT,xom|B|P5,3,3 

Although S12BCM has 13 positions as of 3/25, I don't count it as Leveraged Period (LP) yet.
RDS, GE from MD; and NVS, PFE from SD are very close to stop
This starts the most interesting period in System 12.
Based on rules, I must buy any newly qualified and available MD stocks, even if I have 12 positions on. This will start LP.  I cannot buy any more SD stocks, unless I have less than 12 positions on.
System 12 BCM is Fully Loaded!

BOT:   PG on 3/17;  WMT on 3/21; AAPL on 3/25; XOM on 3/26
SLD:   GOOG on 3/24; AAPL on 4/7;   PFE on 4/7
DIVI received: RDS, MSFT, JNJ, WFC

BHP, CHL, ORCL, TM

This is MD:
http://stockcharts.com/freecharts/candleglance.html?AAPL,XOM,GOOGL,MSFT,PTR,BRK/B,GE,JNJ,WMT,WFC,RDS/B,JPM|B|P5,3,3

MD Control: PG replaced with JPM
I don't have XOM, GOOG, PTR (still disqualified by a smidge)
GOOG changing shares: Apr2 last day Ashares; Apr3 starts classC; Apr8 settlement
 RDS  not sure when earnings. Year end in Dec., results published in March?
BRK annual report in Feb-March?

This is SD:
http://stockcharts.com/freecharts/candleglance.html?CVX,pg,PFE,NVS,IBM,hsbc,BAC,T,bhp,chl,orcl,tm|B|P5,3,3

I have: PG, PFE, IBM, NVS
CVX disq under 118.50; HSBC drops to #18 (disqualified); new addition ORCL!
VOD removed.
-----------------

Sunday, March 23, 2014

Bergamot Soap

I am deeply non-religious person. It doesn't mean I don't  believe in god. I do. Not a man in sky, of course... lol.
I believe in Equiponderance. Time and time again I observe how my actions and thoughts being balanced somehow somewhere by equal force, to offset me back to even. The Great Equiponderator is all around me, at all times... watching, listening... working its magic. He doesn't love me, nor he is out to get me. He doesn't care. All he does - keeping shit in Balance.
May be I should call him "it"?


How did my wife knew about bloody, muddy mess? How did she found Bergamot soap? Why would she buy more expensive soap, when we fast running out of cash? I love that soap. I need it.
Great Equiponderator.

----------------------------------------------------

Short Term S&P 500 Futures Trading.

No, I am not calling it a scam.
There is important and very real purpose for index futures. There are many methods for day-trading ES, some better than others, some fully automated. I thought a had a good one (System 11), but it didn't withstand real world conditions. A major contributing problem is my inability to act fast, decisively and purposefully on very short term time-frame. I have to admit, that i am completely unable to day-trade. I have to make peace with this fact, and walk away while I can. Knowing what I know now, I can see a '2010 disaster' coming fast towards me. I'll be damned not to do something about it.

Fishing Expedition (link) costed me a bit over 10%.
These type of losses (in dollar terms) would be quite trivial in an account 4 times the size, but for me - this is gargantuan and totally unnecessary at this time. What went wrong? Bunch of things, starting with weak execution for picking minor index bottom, mix-up of different time frames and too much leverage. Based on my notes, I observed bottom +/- 10points, but failed to act. Stops costed me too much, most of stop-outs where absolutely pointless. Multiple enters bled my account, as I was demoralized and in physical pain. My back is killing me, I have bruises on legs, and my biceps are so constricted I can't stretch my arms. How can man be so hurt from sitting in comfortable pleather chair? That's capital management for you, suckers...

Technical Analysis (TA) of  price charts is not a scam.
Most of basic and time-tested (by me) general principals of  TA work. Really. Especially so on individual equities charts. Really. This is where true investment interests are being displayed, buyers and sellers come to vote and bet on future prospects of companies and industries. I see them often. They leave familiar foot-prints all over price plot. Over the years (and quite consistently) I was able to properly interpret price/volume patterns, capitalize on many opportunities by following 'bread crumbs'. Again and again I benefited from investing and trading in real industrial stocks and commodities, as well as most forward looking, revolutionary companies. Trading active, fashionable stocks that are tied to the future (Darvas, yes), based on common sense and certain set of long/intermediate charts (aka Matrix). Buying and holding for a meaningful swing, with goal of riding a long and persistent price trend defined by Investment Theme.

TA works great on most individual equities, not so well in sector ETF's and mutual funds, and fails completely on broad indexes. The more I think and research, the more I am sure that the whole purpose of 'index' is to avoid Technical Analysis of price chart, rendering any attempts to time and analyze it pointless most of the time. I have a theoretical and philosophical base for this in a form of 'Dow Paradox' and 'Map is Not a Territory'.
I believe its true. Really.

---------------------------------------------------


Thursday, March 13, 2014

Fishing Expedition

I've been mulling over some philosophical concerns in  "Map is not a territory" post (link) about a month ago.
I ones heard someone comparing market to a puzzle.
A trader works on solving the puzzle, and every time he finds the piece that fits - he receives a prize token with a small monetary value. But I think there is a twist to this story.
You see, when trader goes to sleep... Santa Clause comes and rearranges portion of the puzzle, takes some pieces away and throws in some new ones. His origin is a secret, his reasons are unknown, his logic is moot.
I don't complain. I love the process of solving the puzzle and enjoy them prize tokens. I'm just a little leery of bearded motherfucker... that's all...;-)
Molecool disagreed, as he compared market to hunting:
 You don't care about which way the herd will run. You simply wait for an opportunity to tear into one of the laggards.
Now that is a bit too violent for me, I am too mellow for this kind of metaphor.
I don't even like hunting.
If there is a comparison to animal kingdom, I would go with Leo Cooperman's:
It doesn't matter whether you are a lion or a gazelle; when the sun comes up you'd better be running
Personally, I like to think of stock speculations as fishing...
First of all, fisherman needs a good spot. There is no way of knowing what lurks beneath murky waters - experience and bit of common sense goes a long way in picking a proper location. Preparation matters a lot - gear, bait etc. Gotta go out early ahead of time, to be ready for sunrise. Still, there is no guaranty that fish will bite. All the worms in a world will not help without a bit of luck (try back-testing that... lol).
Patient and skilled fishermen will not go home empty-handed (most of the time).

With that in mind, I embarked on a fishing expedition to pick a minor bottom in SPX via futures (amongst other things).
This is a really weird contract roll, btw. Open interest (OI) is very high still, considering that July will become front month today. It is my own theory, that high OI is indicative of large short position in ES futures. Even after a couple of days of heavy selling, March OI is still over 3mil. How these people are going to cover? They are out of time.
Most surveys show very low or even extreme low in bearishness, which is usually indicative of market top. Usually... After a 5 year bull market one wouldn't expect to find many bears. Not vocal one's, anyway...

I drew a crayon for SPX a month ago, exactly on a day of the bottom here (link), after a 6%ish correction. 1850 high was taken out and will act as support. If the is no overlap, then this market is even stronger that it seems. Fib target from that chart is 1898. My point-n-figure targets are 1974-1978, followed by 2115 (what?)... Lets first get to 1890, then we will see.
I am using System 10, designed just for this condition - a correction in major trend, with entry technique by System 11. Combining the two was a really good idea, as it takes care of major problems for both. System10 often suffered a draw-down, but never had a losing campaign. System11 never had a major loss, but often ends break-even or worse.
Fishing expedition is in progress. Hope I don't fall face in a mud.

UPDATE 3-22-2014:
 Everyone has a plan until they get hit in the face. - Mike Tyson 
Turns out mud was the least of my problems...
Under it was a sharp stone - I got blood and sweat, and mud all over my face
Bruised and humiliated, but not on my back... far from it

------------------------------IN THE NEWS--------------------------------
Ukraine, Crimea, Putin, war, Maidan, pipelines, Black Sea, 15 Billion, corruption...
So much talk, when really its all very simple. Ukraine borrowed 15bil, not its time to repay, but they are broke. Somebody (cough...Putin...cough) will give the money. Somebody ( Ukr government...cough) will steal some of it. Problem is - there is no functional government in Ukraine. Solution - its Jews fault... what else.

Overall - there is no news. Nothing! I don't watch much TV anyway, but things usually get to me somehow. Not lately. So I've been flipping thru channels, and also on a radio, for a couple of days - but there is nothing!. Little bit here and there, but mainly we don't have economy, politics, foreign affairs, scandals, scams, crimes or unemployment.
We have pleasant, giggling, mindless stories about nothing

Tuesday, March 4, 2014

System-9 Asset Allocation

First of all, congratulations to iBergamot:Bergamot Capital Management (BCM) is fully operational!
I need to change my slogan. "Working full time; Trading the rest of the time" is no longer true.
Also, I really don't need to keep this blog going, but will anyway.
My journal helped me on several occasions.
----------------------------------------------

System 9 account grew significantly lately, and now can hold over 30 positions of my standard size. I was thinking about increasing position size, but decided to hold off. Rather I want to classify my holdings by asset type, in order to keep each segment from growing too big.
OTOH each active theme in System 9 should be represented by meaningful investment.

3 full positions is approximately 10% of portfolio.
Investment Theme that doesn't have 3 (full or half) positions on will not be classified separately, but will go into one of following groups:
- Industry. 
   Stocks/ETF of Real Stuff, producers, manufacturers etc that make things and use stuff.
- Other Stocks. This section presently holds DVA, GEO, MHFI, YELP - like I said... other stocks...

Industry       23%
Other            9%
PM             22% (precious metals and miners)
Agriculture  18%
International  9%
Shippers       8%
Marijuana     4% (I sold more than half from LB account)
Cash less than 10%

I have most of these (few that i don't have - i am looking to buy)
http://stockcharts.com/freecharts/candleglance.html?MHFI,GEO,DVA,YELP,NM,TK,KEX,TUR,VNM,FXI,AFK,RSX|B|P5,3,3
http://stockcharts.com/freecharts/candleglance.html?AMLP,XLU,FIUIX,LYSDY,NIB,BAL,JJG,LNN,MOO,MON,TSCO,ige|B|P5,3,3
http://stockcharts.com/freecharts/candleglance.html?JJC,FCX,SCCO,CCJ,CVV,GTI,TAN,SCTY,ibb,bis,IYR,xhb|B|P5,3,3
http://stockcharts.com/freecharts/candleglance.html?HEMP,PHOT,MJNA,MDBX,AG,CEF,FNV,GDX,PPP,RGLD,SLV,SPPP|B|P5,3,3

------------------------------------------------------------------
http://stockcharts.com/freecharts/candleglance.html?ONVO,DDD,ENPH,EZPW,SWI,FEYE,SPLK,WDAY,xrt,imax,lo,cacq|B|P5,3,3
http://stockcharts.com/freecharts/candleglance.html?pot,mos,adm,hrl,bg,entg,urz,dnn,cg,bx|B|P5,3,3
http://stockcharts.com/freecharts/candleglance.html?CWEI,WTI,HK,NBR,PBR,SGY,STLD,MTL,AKS,MT,CRS,X|B|P5,3,3
------------------------------------------------------------------

Saturday, February 15, 2014

System 12 2-2014


 ------------------Internals Update--------------------
Its safe to assume that T12/2013 from this post (link) was blown out by new low on T-Theory Volume Oscillator. It went below -80, way lower than T12/2013 low, and recovered sharply - classic bottoming behavior. There was no positive divergence at bottom, so retest within 2 months is possible.
Interesting that new VOT2/2014 points to mid June 2014, just like VOT6/2013 I plotted back in December!
Spooky...
VO T 2/2014


System 12 BCM:
http://stockcharts.com/freecharts/candleglance.html?WFC,RDS/B,NVS,MSFT,GOOG,PFE,JPM,JNJ,brk/b,ibm,ge|B|P5,3,3
MD Control dipped almost 6% from beginning of year, and still under-water as of 2/15/2014.
S12BCM started 1/28/2014, was down negligibly. Presently positive and accumulating.
(UPDATE: added JNJ on 2/20; BRK/B on 2/25; IBM on 2/27; GE on 3/6; BHP stopped out)
BHP, VOD, BAC, T

This is MD:
http://stockcharts.com/freecharts/candleglance.html?AAPL,XOM,GOOG,MSFT,PTR,BRK/B,GE,JNJ,WMT,WFC,RDS/B,PG|B|P5,3,3

MD Control: CVX replaced with PG
I have:  GOOG, MSFT, WFC, RDS/B
PTR still disqualified.
RDS  not sure when earnings. Year end in Dec., results published in March?
BRK annual report in Feb-March?
WMT 2/20b

This is SD:
http://stockcharts.com/freecharts/candleglance.html?JPM,CVX,HSBC,PFE,NVS,IBM,CHL,TM,BHP,VOD,BAC,T|B|P5,3,3
I have: JPM, NVS, PFE
HSBC annual report in Feb?

Shopping list:
http://stockcharts.com/freecharts/candleglance.html?AAPL,XOM,BRK/B,GE,JNJ,WMT,PG,hsbc,ibm,bhp,vod,bac|B|P5,3,3

UPDATE  2/22/2014
For  research purposes, I wanted to see optimized Daily MA's for System12 stocks. If 50/200 don't fit well, then 25, 80 and 100 seem to provide better signals. 100ma work for major multi-months trend continuation. 25ma work for early exit after multi-weeks uninterrupted advance. These results are preliminary, and require further testing. Still I don't have an answer on how to sidestep multi-month sideways chop. I guess it all depends on market conditions and what is available from MD and SD - meaning : if no better opportunities are offered, then its better to sit sideways and collect a dividend. I painted myself in a corner here...
http://stockcharts.com/h-sc/ui?s=$SPX&p=D&yr=2&mn=0&dy=0&id=p82691261269

-------------------------------IN THE NEWS---------------------------
I already heard several times about companies that shoot new, smaller and faster satellites into space to provide photo and video images of Earth. Skybox and Planet Lab are all the talk, took 100mil of investments, but not public. There is DGI (+400% in 2 years), Orbital Sciences ORB (+200%) and bunch of others, not forgetting about Elon Musk's space rockets.
 "Starship Enterprise" (lol) will be the name of this theme.
http://www.spacenews.com/

Coffee is diseased with 'rust' - OMG!  TV says rust to blame for high coffee prices... Am I mad?...wasn't coffee in bear market for few years? I can't explain, but was looking at the situation for a while.

Peace talk with Syria broke down again... what are they negotiating...?

Thursday, February 13, 2014

More Real Stuff - Agriculture

...developing...

Continue my research of commodity theme, aka Real Stuff.

Some observations:
- Investing in commodities, as a group, via index and corresponding etf may not be practical. Detailed review in this post (link). The biggest and most liquid etf is DBC, which is a pure gambling (rebalanced in November), and been stuck in 24-29 range for 3 years.
- I will be using $CCI (corresponding etf is GCC) and RJI as base line broad commodity index. RJI seems more liquid. Both are volatile like hell, but really don't move enough to make up for aggravation. Both seems to be painting some kind of sideways base on weekly chart, but I don't want to get involved with long term investment in these, because costs are very high.
- There is no sensible way to short commodity index via inverse etf's. Some inverse leveraged etf's (like SCO) are usable tradable instruments for short term only (days, not weeks). Decay and costs are very real and brutal. There is no practical way to sell short these commodity inverse leveraged etf's either (see update in this post link)
- Need to dig deeper into sub-themes, and possibly find some long-term trends. Commodities are not like stocks, they are not an asset class. Rather they are input costs, that can be forecasted and stored for future use. Here I go again with forecasting, but really - manufacturer need to plan ahead what to order from producer, who needs to let miner/grower know how much stuff they will need, because mining/growing takes time, and doesn't always work out. THEY need a forecast. Still, they are only human (hopefully) and do make mistakes. Error in forecasting creates rapid repricing, aka market turns, more often than trends

Right off the bat, I am familiar with Agricultural Commodities.

Following and trading grains via etf's since 2012, I wrote Food Riot post (link) with definite bullish bias, because "I think we will never pay low prices for food again". That assertion was correct, as our food shopping is more expensive than before, however trading on this opinion costed me some last year. To wit, all grain etf JJG is much lower now. My stops and position sizing served as excellent protection, my losses in grains are trivial, as I continuously trying to pick a bottom. Corn is not going to zero.

http://stockcharts.com/freecharts/candleglance.html?GCC,RJI,RJA,DBA,DAG,JJA,JJG,COW,moo|B|P5,3,3
http://stockcharts.com/freecharts/candleglance.html?DBA,JJG,$SOYB,SOYB,$CORN,CORN,$WHEAT,weat,BAL,NIB,JO,SGG|B|P5,3,3


I entered JJG again on 2/4/2014 and wrote here (link):
Now there seems to be a legit double-bottom setting up. I marked it on a chart. 43.level has to hold, if there is an immediate back test. Measured move takes us to 100day ma.
I got 1/2 position on

If anybody heard any rumors, fundamentals, planting intention etc - PLEASE DON"T TELL ME!  I don't want to know
(People replied with funny pictures, and I made some general comments anyway) 

 I have half size BAL (cotton), half JJG, full size NIB (cocoa) and want more.
---------------------------------------------------
DBA 
 PowerShares DB Agriculture Fund tracks DBIQ Diversified Agriculture Excess Return Index, rebalanced in November to base weights and then just rolls active contracts.
Allocation makes sense, except I think coffee is too much and cotton too little, but what do i know...?
Corn           12.50
Live Cattle  12.50
Soybeans    12.50
Sugar         12.50
Cocoa        11.11
Coffee        11.11
Lean Hogs        8.33
Kansas Wheat  6.25
Wheat              6.25
Feeder Cattle   4.17
Cotton              2.78

There is a very clear possibility of double bottom on DBA, with implications for extended rally in Ag Commodities and Lifestock.
---------------------------------------------------
RJA - another Mr Bow-Tie's monstrosity, with 21 components, covering not just the usual Ag's and Cows, but also lumber, rubber, rice, OJ, and even milk (0.2%). Largest allocation (over 10%) are Corn, Wheat, Cotton, Soy; followed by Coffee, Cattle and Cocoa. Makes sense to me.
Rogers Agriculture Index is 35% of RJI, and is second largest component of Rogers International Commodities Index, after Energy. RJA is also rebalanced at the start of every month back to initial weights.

Although, RJA doesn't have a well pronounced double-bottom (like DBA), its weekly chart also shows positive divergence on oscillators, best 3-weeks rally in many months. $8 level must hold any reaction, or there is no bottom
---------------------------------------------------
DAG is a note (etn) on corn, soy, sugar and wheat at 25% each
----------------------------------------------------
JJA is a note (etn), sector weights make no sense whatsoever, usual 0.75% fee
---------------------------------------------------
JJG - another iPath note - all grain etn
Soy   42%
Corn 35%
Wheat 22%
---------------------------------------------------
 Water - PIO, PHO
----------------------------------------------------

 DBB - PowerShares Base Metals is equal thirds aluminum, zinc and copper. Rebalanced in November and roll.
Frequently goes premium/discount to NAV by as much as 1%.

---------------------------------------------------

Thursday, February 6, 2014

The Map is Not the Territory

Following is from Wiki http://en.wikipedia.org/wiki/Map%E2%80%93territory_relation:
Alfred Korzybski remarked that "the map is not the territory", encapsulating his view that an abstraction derived from something, or a reaction to it, is not the thing itself. Korzybski held that many people do confuse maps with territories, that is, confuse models of reality with reality itself. ...  individual people in fact do not in general have access to absolute knowledge of reality, but in fact only have access to a set of beliefs they have built up over time, about reality.
This is a very eloquent depiction of the reason why I stopped forecasting index trends.
Forecasting of market trends is a bad approach any way you slice it. It makes one to have an opinion, a bias, that has to be expressed  in terms of long or short position. Every next bar brings new information, supporting prediction or not, until some time in a future trader can look back and realize whether his forecast was right or wrong originally. I've been working this way for years, and this is the best explanation why my index trades have never been a steady source of profits. Quite the opposite.

This tuition, paid to "S&P500 Futures University", was not wasted (hopefully) and resulted in System11 - a simple and robust approach to short term index trading. On the other extreme end is System1 - a long term stock/bond index system, that never had a losing year, but also sidestepped most of 2013. System1 was designed in a way to avoid major bear market (and it did), but relies heavily on my own opinion and vague concept of "Enough", which needs to be discarded. I am in a process of modifying System1 rules. It will take awhile, as long term system testing takes a long time (no shit).

Financial speculation is a process of making an aggressive monetary bet, based on incomplete information, for uncertain period of time. The Technical Analysis of price chart can't tell the future. It could tell  where we have been, where we are now, and what may happen next (based on interpretation of conditional probability). Never 100%, not even close. 50/50 is the best I can wish for, yet it still requires forecasting, albeit to a lesser degree. A "SET-UP" is what investment community came up with, to fool themselves into thinking that they don't have a bias. A certain quantifiable set of conditions, that lead to recognizable outcome most of the time. Isn't this an 'opinion' again? What is it based upon? Squiggly-wiggly lines on price/time plot of some financial scam?
Give me a fucking break...

----------------------------------------------
 "The financial markets generally are unpredictable. So that one has to have different scenarios. The idea that you can actually predict what's going to happen contradicts my way of looking at the market." [Soros]
 http://socialleverage50.com/2013/09/22/stanley-druckenmiller-greatest-moneymaking-machine-history/
---------------------------------------------

Shopping list:
http://stockcharts.com/freecharts/candleglance.html?sea,kex,tk,nm,nmm,cmre,dsx,sb,dba,bal,nib,mon|B|P5,3,3
http://stockcharts.com/freecharts/candleglance.html?FSPHX,IBB,DVA,MHFI,BX,GEO,SCCO,DOW,CVV,FCSMF,adsk,ddd|B|P5,3,3
http://stockcharts.com/freecharts/candleglance.html?xhb,itb,iyr,socl,yelp,angi,cmcsa,twc,ebay,|B|P5,3,3
http://stockcharts.com/freecharts/candleglance.html?eem,tur,fxi,pgj,hao,rsx,afk,nge|B|P5,3,3

--------------------------------------------
Positions:
http://stockcharts.com/freecharts/candleglance.html?HEMP,PHOT,MJNA,MDBX,AG,CEF,FNV,GDX,PPP,RGLD,SLV,SPPP|B|P5,3,3
http://stockcharts.com/freecharts/candleglance.html?CVV,MHFI,GEO,JJC,JJG,LNN,NM,SCCO,TK,TUR,VNM,FXI|B|P5,3,3
http://stockcharts.com/freecharts/candleglance.html?AMLP,XLU,FIUIX,LYSDY,NIB,BAL,TAN,SCTY,ccj|B|P5,3,3
UPDATE 2/14/2014
As soon as finished taking stops on many common stocks, I saw many new set-ups. With broad rally accommodating, I am now 70%+ invested and want more on some kind of reaction.
1800SPX has to hold for few days. then we will see...
-----------------------------------------------

As i was writing this musing, I realized that there is a philosophical problem with what I do, and got stuck. So I published it at Molecool's site, hoping that some replies will get me 'unstuck'. Below are some excerpts of  discussion we had here: http://evilspeculator.com/?p=40387#disqus_thread

Wednesday, February 5, 2014

My A/D Indicator and Internals Update

Over past few days I stopped out of almost all common stock holdings, except gold, silver, miners, pot (in LB account), utilities and couple of other things. I don't have any shorts on. System 9 is over 50% cash, account continuously pushing new equity highs. System11 had  a streak of winning trades, even thou I trade it sporadically and missed most of good opportunities. System12 stalled (as it should in correction) with only 4 positions so far.
I am crazy busy at work, as my departure nears. Already started to train my replacement - she is very bright - hope she doesn't quit before I leave...lol

I will be cashing out most of marijuana stocks from Z account, in order to pay for Boichik trip to Italy next year. Only a few months ago it seemed absolutely impossible. This is a great news, and a major achievement for me - to make and withdraw a significant amount of money from the market!
I feel very proud. Remember Ibiza - The Impossible Dream... Will happen someday too...

-------------------------------------------------------------------------

I started to get ideas about how to use My A/D Indicator (MADI) about a year ago in this Internals Study (link). Since then I added and changed  few things. First of all, I now mostly use NYSE Advace/Decline issues (NYAD), because it seems to produce cleaner signals, but still look to Nasdaq (NAAD) for confirmation. Sometimes they diverge - I don't know what it means.

This is what now are MADI Rules for Bull Market ( I suspect that bear market will produce different levels, but don't have data to test):

- When 20ema is under 0 - market is consolidating or falling. Bottom will be made before 20ema recovers above 0.
- When NYAD 20ema goes below -200, and doesn't recover quickly, - it will go lower and produce at-least a tradable bottom at much lower levels. Most common next level is -400 to -600. Note that August 2011 bottom was -900 on 20ema! This spike lower will get a retest most of the time.
- When NYAD 50ema goes to or below -200, then its a Just Buy The Fucking Dip (JBTFD). This seems to be the most reliable use of MADI.  Buyable dip happens couple of times every year, usually followed by second dip of indicator 2 weeks to 2 months after extreme reading of -200 (or less) on 50ema of Advance/Decline issues. Failure of this bottom may lead to mini-crash (this is what happened in 2011)
- In order for bottom to be complete 20ema has to rally fast and recover above 0.
- In a bull market, MADI will spend more time above 0, allowing to keep positions longer and add on dips.
- "Sell The Rip" is generally at NYAD 20ema +400, but can go to +600/+700. As it is, its not a good signal to short the market - several of these high readings where just run over in early 2013. I'd say - when indicator is that high, probably too late to buy.

MADI 2/2014
3 year study of MADI is here (link)
----------------------------------------------------------
T-Theory Volume Oscillator checked at -80, the reading usually associated with tradable bottom. It may be already double bottomed. Unfortunately it may have destroyed T12/2013 (from this post link). I will wait for a rally, to see if market really bottomed, and revisit T-Theory then.

Confidence Indicator dumped, treasuries are a place to be since the beginning of the year, investment grade corporate bonds are better than high yield junk (no shit).
Golden Indicator warning that shocks are weak, although S&P and developed markets are stronger than Emerging.

-----------------------------------------------------------
http://www.zerohedge.com/news/2014-02-04/marc-faber-fears-vicious-circle-downside-just-beginning
Mark Faber warning again. Treasuries are the place to be for next 3-6 months. I already have VUSTX in System 1 account, not looking to add for now.
-----------------------------------------------------------
 Nadeem_Walayat see ..."No sign whatsoever that this  bull market is anywhere near being over!"
 "THIS stocks stealth bull market is one of the GREATEST bull markets in HISTORY!"
"The current stock market correction looks set to attempt to revisit 15,000. How close it gets to 15,000 I can't tell, perhaps half way, just that the correction is not done to the downside."
His favorite sector is Biotech, and has been forawhile.
http://www.marketoracle.co.uk/Article44238.html
-----------------------------------------------------------
http://www.zerohedge.com/contributed/2014-01-23/roubini-many-davos-speakers-think-it%E2%80%99s-1914-%E2%80%A6-right-ww1-broke-out
Classic ZeroHedge. The world is ending...again...any day now...
------------------------------------------------------------

Weekly Nasdaq A/D Cumulative
http://stockcharts.com/h-sc/ui?s=$NAAD&p=W&yr=3&mn=0&dy=0&id=p03531550066
My A/D Indicator (NYSE) with BPSPX and SPXA50R
http://stockcharts.com/h-sc/ui?s=$NYAD&p=D&yr=2&mn=0&dy=0&id=p24055471029
McClellan Suite: NYMO; NYSI; NAMO
http://stockcharts.com/h-sc/ui?s=$NYMO&p=D&yr=1&mn=0&dy=0&id=p04197492070
T-Theory Volume Oscillator
http://stockcharts.com/h-sc/ui?s=$NYUD&p=D&yr=1&mn=0&dy=0&id=p81565637438
Risk-on /Risk-off ratios, aka Confidence indicator (FAGIX:VUSTX;  HYG:LQD;  $SPX:$USB)
http://stockcharts.com/h-sc/ui?s=FAGIX:VUSTX&p=D&yr=1&mn=0&dy=0&id=p43022938657
Golden Indicator with World Ratios
http://stockcharts.com/h-sc/ui?s=$SPX:$GOLD&p=D&yr=1&mn=0&dy=0&id=p51708175586
----------------------------------------------------------
http://ibergamot.blogspot.com/2013/12/new-t-and-internals-update.html
http://ibergamot.blogspot.com/2013/09/internal-indicators.html
http://ibergamot.blogspot.com/2013/04/internals-study.html

------------------------------ In The News ----------------------------
Solar activity is productive with M-class flares every day. "Solar activity is expected to be at moderate levels with a chance for high levels through 09 February", sais NOAA.

Now we have a new Fed Chairman(woman). Bermonkey is no more. Good riddance.

Emerging markets are submerging again. Turkey, Argentine, Brasil, South Africa, bunch in Asia, etc are in some kind of currency crisis. China got banking problems. I am looking to buy the blood.
Here is very smart India central bank Governor Raghuram Rajan talks  about interest rates, fund outflows, the rupee and global monetary policy coordination on Jan 30.

-------------------------------------------------------------------------