BOT:
2/1 - CCJ - 21.72 (return of "Uranium Trade"? - I've been waiting for this)
2/1 - TM - 97.50
1/30 - BHP - 78.66 (S12T) technically its not in MD, but its #14 and in BTFT and looks good
1/30 - BRK/B - 96.87 (S12T)
1/30 - SCTY 14.31 Half pos. Lets try it again. 13.50 is only support.
1/29 - EEM 44.16 One day its lagging, another leading... I have no idea. Close stop.
1/29 - XOM - 91.50 (S12T)
1/29 - PTR 142.80 (S12T)
1/29 - CVX 116.64 (S12T ; BTFT)
1/28 - GOOG 754.55 (S12T)
1/28 - IBM (S12T ; BTFT)
SLD:
1/30 - IWM 88.78 Sold 1pos on stop, still have 1pos on, waiting for 20dma.
1/30 - FB 31.23 Half-size out. Have 1/2pos on. ER is a disaster, down 7% AH. Holding.
1/29 - FB 31.19 Half-size out. Still have 1pos on. Earnings tom AMC. Need to sell half before.
1/25 - CG 31.01 Half out. This thing is up 20% in 10 days. wow. SR is still 12; P/E 2 (TWO!) ER - 2/21. Achieved all targets from this post (link), there will be more (this bull has legs)
1/25 - EEM 44.02 (small gain) All out - emer mrkts have been lagging for days. Looking to re-buy.
1/25 - TAN 18.35 out on possible double top and bad news.. Looking to re-buy.
1/25 - SCTY 15.45 (B/E) on bad reaction to news. Looking to re-buy.
on SCTY (1/25/13) - Only yesterday I was buying more, cus it Looked like this is all of reaction its going to get. I was hoping to buy more around 15... And today Fucking politicians are killing Solar industry again.
http://www.greentechmedia.com/...
Arizona, Pennsylvania, New Jersey - just this week. Wait for more announcements.
SCTY is a new issue, with no earnings history, no analyst coverage, hell - it doesn't even have a message board on Yahoo.
May take some time.
Patience
I have, tolerance for losses I do not. With only support at 13.50ish
(thats over 10% down from here), I would rather wait without position
than hope.
Positions:
Notes 1/30:
TBT has to hold Jan low 63-64, or its a trap again.
KOL, SLX are failing
IBB stop on close under 144
http://stockcharts.com/freecharts/candleglance.html?IWM,XLU,$CEX,XHB,CG,TSLA,FB,JJG,TBT,KOL,SLX,IBB|B|P5,3,3
$CEX, XLU are for tracking intraday for FIUIX, FSCHX
IWM, Chemicals and Utilities are 2x positions, CG half, FB 1.5x
Watch List:
http://stockcharts.com/freecharts/candleglance.html?SPY,GEO,IGE,TAN,SCTY,DRYS,UGA,ORB,GSVC,DDD,moo,rgr|B|P5,3,3
also
http://stockcharts.com/freecharts/candleglance.html?SEA,TM,SMH,NIB,XLK,XLF,yelp|B|P5,3,3
MD - all must be entered by Feb 8, unless exit criteria met. This will start S12T.
http://stockcharts.com/freecharts/candleglance.html?XOM,PTR,GOOG,BRK/B,GE,IBM,RDS/B,CVX|B|P5,3,3
Update 1/29 - still need BRK/B, GE, RDS/B. BHP set up nicely for tomorrow, its in BTFT and #14, but I'll take it just the same.
BTFT - all entered into OX paper trade on open 1/28/2013.
http://stockcharts.com/freecharts/candleglance.html?HBC,BHP,PTR,JNJ,FMX,NVS,ORCL,PFE,TM,GOOG,BRK/B,XOM|B|P5,3,3
GE, IBM, RDS/B, CVX are not in BTFT and will have to be added within 2PP. This will start LP.
Monday, January 28, 2013
Sunday, January 27, 2013
System 12 aka MegaDozen
Behold!
Possibly my greatest achievement - System 12 !
Why there is no System 11? Actually I have an Idea for it, so keeping "number" 11 reserved.
This is a rule based, (almost) mechanical, statistical system.
Fixed position sizing, diversification and overreaching risk controls.
Back test was run 9/4/2012 to 1/25/2013 and projects 20% annually, with maximum draw-down of 12%.
I took out-most care to avoid hindsight bias, included larger commission and slippage, and took all actions that was common to me, even seeing that they will result in small losses shortly thereafter. The key here is losses where small, because of risk management. Even AAPL, I had to buy at extended price in the beginning of back test, while producing largest loss of all, still exited early enough to avoid 30% collapse in price.
I started back test in September 2012, at very inopportune time, knowing that market will tank in Oct-Nov. I wrote what I thought throwout whole period. How hard it was to keep positions, how many collapsed and never recovered, and how incredibly hard it was to enter and keep new positions in over-bought, over-extended market. I made a fine profit during this period, but had to fight thru many concerns and contradictions.System 12 answers all these questions will rules and mechanical execution. "Almost" mechanical, because I have time to act - a Positioning Period (PP). The only amendment to exit rules is an Emergency Exit (EE), when there is a big downside gap, Expanded Range (ER) day near support area. Back testing shows that, without exception, these conditions lead to lower prices. EE was not used in backtest.
Quite possible that equity curve can be used as forward looking indicator of market conditions, based on divergence with SandP500. Non-confirmation at end of October, when SPX was making final rally attempt to 1460 but equity was plummeting, should have been used as warning and requirement for EE.

Maybe I am getting ahead of myself, but i decided to run simultaneously Back Test with Forward Test (BTFT) and System 12 Transition (S12T). I will keep two sets of records, so i can analyze them. System 12 can be run with UNLIMITED amount of money, so this only first transition. better to learn from small mistakes...lol.
BTFT will start on Monday 1/28/2013 at open in OX paper account. There is a problem for beginning of February - I didn't have to re-balance Mega Dozen (MD) yet. Now i have to, because many of MD where not available at November low, so I had to go to Second Dozen (SD). Now that some of MD available again - I need to switch, or go into Leverage Period (LP). I like an idea of LP, because it pains me to sell a winner.
S12T will also start on Monday. I will use 2PP to enter as many as I can of MD. Then will reassess. BTFT will go into LP and its fine with me. I estimate 3 months for S12T to come in sync with BTFT.
Possibly my greatest achievement - System 12 !
Why there is no System 11? Actually I have an Idea for it, so keeping "number" 11 reserved.
This is a rule based, (almost) mechanical, statistical system.
Fixed position sizing, diversification and overreaching risk controls.
Back test was run 9/4/2012 to 1/25/2013 and projects 20% annually, with maximum draw-down of 12%.
I took out-most care to avoid hindsight bias, included larger commission and slippage, and took all actions that was common to me, even seeing that they will result in small losses shortly thereafter. The key here is losses where small, because of risk management. Even AAPL, I had to buy at extended price in the beginning of back test, while producing largest loss of all, still exited early enough to avoid 30% collapse in price.
I started back test in September 2012, at very inopportune time, knowing that market will tank in Oct-Nov. I wrote what I thought throwout whole period. How hard it was to keep positions, how many collapsed and never recovered, and how incredibly hard it was to enter and keep new positions in over-bought, over-extended market. I made a fine profit during this period, but had to fight thru many concerns and contradictions.System 12 answers all these questions will rules and mechanical execution. "Almost" mechanical, because I have time to act - a Positioning Period (PP). The only amendment to exit rules is an Emergency Exit (EE), when there is a big downside gap, Expanded Range (ER) day near support area. Back testing shows that, without exception, these conditions lead to lower prices. EE was not used in backtest.
Quite possible that equity curve can be used as forward looking indicator of market conditions, based on divergence with SandP500. Non-confirmation at end of October, when SPX was making final rally attempt to 1460 but equity was plummeting, should have been used as warning and requirement for EE.
Maybe I am getting ahead of myself, but i decided to run simultaneously Back Test with Forward Test (BTFT) and System 12 Transition (S12T). I will keep two sets of records, so i can analyze them. System 12 can be run with UNLIMITED amount of money, so this only first transition. better to learn from small mistakes...lol.
BTFT will start on Monday 1/28/2013 at open in OX paper account. There is a problem for beginning of February - I didn't have to re-balance Mega Dozen (MD) yet. Now i have to, because many of MD where not available at November low, so I had to go to Second Dozen (SD). Now that some of MD available again - I need to switch, or go into Leverage Period (LP). I like an idea of LP, because it pains me to sell a winner.
S12T will also start on Monday. I will use 2PP to enter as many as I can of MD. Then will reassess. BTFT will go into LP and its fine with me. I estimate 3 months for S12T to come in sync with BTFT.
Thursday, January 24, 2013
Rotten Apple
BOT:
1/24 - SCTY 16.08 Half, now I have full position
1/24 - IBB 144.51
IBB - biotechnology ETF.
Building a bull flag, challenging last years high.
Not sure if this is a good spot to buy, it can correct to 140-142 and still look good. If that happens - this bull flag on daily chart will most likely morph into something else.
Watching 1st hour.
IBB sold off at open every day since 1/10 without exception. Change in this behavior will be a major tell
This rotten AAPL reported yesterday after close, and collapsed by 10% AH on pretty big volume.
I generally don't trade earnings and I haven't traded AAPL in a long time, but I really wanted to buy it yesterday thinking that it already fallen alot and bad news should be discounted by now. Guess not.
Also from yesterday:
http://evilspeculator.com/?p=33410#comment-775659947
ES open interest suddenly jumped to 2.9mil cars.
I maintain the view, that increase in open interest means an increased demand for shorts. I cannot believe this! People getting short into this non-stop ramp, or I am completely wrong on this "open interest" premise? I understand that correction of few percent will come sooner or later, but to make a short trade over past 2 days would require knowledge and skills I do not possess.
SPX
I haven't seen Mole's famous PF chart. Must be in sub-only section...
How long it can go on? I have 1600ish. Too high? Mole's 5 point PF target is 1690 and keeps growing !
This shit should be illegal, but it works
Until it doesn't
These two MA I have... they will cross again...someday...
Molecool pointed out:
"Well, I checked a year ago and the P&F then was suggesting 1500+. So never forget that these are LONG term charts. A lot can happen in between."
I replied:
Thats true.
My PF also had target of 1482, but then my MA's crossed and that would be an exit right before tax-day. ''Would" - because I did not use this chart back then. It became a part of my system last summer, thanks to you btw.
Point-and-figure charts from yesterday and rally in the beginning of last year :


Convictscott writes:
''The thing is that it is part of human bias to want to "get it right" and pick tops. It gives our ego a stroke. So for that (and other) reason the counter trend setups subjectively nearly always LOOK MUCH BETTER than the higher probability with trend setups.
It is extremely rare for a major top not to be retested. You should never get short a higher timeframe trend until this happens.''
Couldn't say it any better myself
Pearls of Wisdom of Jesse Livermore's fame:
Couldn't say it any better myself
Pearls of Wisdom of Jesse Livermore's fame:
"The game taught me the game. And it didn’t spare me rod while teaching."
"It sounds very easy to say that all you have to do is to watch the tape, establish your resistance points and be ready to trade along the line of least resistance as soon as you have determined it.
But in actual practice a man has to guard against many things, and most of all against himself – that is, against human nature."
"The game does not change and neither does human nature."
Monday, January 21, 2013
Things to do when Volatility Died
BOT:
1/22 - FB @ 30.65 Half pos. Now I have 1.5position on and want more.
1/22 - TAN @18.40. Half pos. Solars are very strong, looking for br-out from bull flag. Will add, not going to hold too long - next swing high is target.
SLD:
1/22 - NIB @30.
Cocoa is back in a box. I consider breakout failed. Daily chart looks like bear-flag. No re-entry for 4 days.
So Volatility via VIX is below 13, which is lowest reading in over 3 years. That among other factors, prompting people to think that the Top is at hand. Fools. Vol can stay low for months and years, infact it did so in 2004 (or there-about), creating a treacherous short squeeze, low-volatility advance - an essence of long-term bull market.
Low VIX is not an actionable trading signal. Based on this chart, VIX is at historically "normal" level.
 I don't want to have a forecast. Neither short, nor long term. I can make a bunch of valid arguments for and against long-term bull market. Having said that, I feel mighty giddy. I should. I already made more money in this January than in all of 2012. So this is for sure a time to be careful, bring the stops closer, see if I can rotate from over-extended areas into something that about to get going. Except, I don't see anything interesting right now.
So what do I do on Wall Street when Volatility Dead?
Ongoing project to make lists of ETF grouped by industry or affiliation:
(concept still not clear)
http://stockcharts.com/freecharts/candleglance.html?$NYA,$SPX,$COMPQ,IWM,QQQ,eem,$TNX,TBT,GLD,SLV,USO,AAPL|B|P5,3,3
http://stockcharts.com/freecharts/candleglance.html?$CRX,XLU,XLE,OIH,$XNG,GDX,$RXH,XRT,IBB,$XBD|B|P5,3,3
http://stockcharts.com/freecharts/candleglance.html?$SPX,$COMPQ,$NIKK,EWJ,EEM,FXI,EWS,EWM,EWH,IFN,vnm|B|E6,12,9
http://stockcharts.com/freecharts/candleglance.html?REMX,REE,LIT,URA,NLR,KOL,MOO,PHO,PIO,TAN|B|P5,3,3
Main 1. This one makes sense. Not sure of GCC. Need commodities futures index, but not sure of equal weight or like CRB ?
http://stockcharts.com/freecharts/candleglance.html?$NYA,$SPX,$COMPQ,QQQ,IWM,EFA,EEM,$TNX,UUP,GLD,USO,GCC|B|P5,3,3
Main 2. Don't like this list. Need to think
http://stockcharts.com/freecharts/candleglance.html?spy,dvy,lqd,hyg,tlt,tbt,dba,gld,slv,ige,$cex,ibb|B|P5,3,3
Biggest on Wall-street. Sum of market caps is little over 3 Trillion ! "Mighty Dozen"? Giant Dozen?
Surprisingly, not only they (as a group) do not outperformed SPX , they are not very much correlated to SPX either. All, except Buffett and PTR are part of S and P 500.
Note: I included PetroChina, because it's #3 in the world now, otherwise I decided to stick with good 'ol USofA. Used market cap data for BRK/A, included B-shares for ease of use.
I am going to make a chart in Excell. Average closing prices, throw in a couple MA's and see what happens.
http://stockcharts.com/freecharts/candleglance.html?spy,aapl,xom,wmt,goog,ge,msft,cvx,ibm,jnj,ptr,brk/b|B|P5,3,3
Very strong housing and real estate sector:
http://stockcharts.com/freecharts/candleglance.html?$SPX,FSHOX,XHB,ITB,IYR,VNQ,ICF,RWX,RWO,DRV,SRS|B|P5,3,3
Technology. Not sure of this selection, I made this list awhile ago. Why is EWX here?
http://stockcharts.com/freecharts/candleglance.html?XLK,IYW,VGT,EWX,SMH,IGV,IXN,FDN,IYZ,GSVC,socl|B|P5,3,3
Commodities (not finished)
http://stockcharts.com/freecharts/candleglance.html?$CRB,$CCI,DBA,DBC,IGE,GCC,$CRX|D
GCC=CCI (equal weight 17 futures); DBC=CRB? ; CRX is a commod based stocks
1/22 - FB @ 30.65 Half pos. Now I have 1.5position on and want more.
1/22 - TAN @18.40. Half pos. Solars are very strong, looking for br-out from bull flag. Will add, not going to hold too long - next swing high is target.
SLD:
1/22 - NIB @30.
Cocoa is back in a box. I consider breakout failed. Daily chart looks like bear-flag. No re-entry for 4 days.
So Volatility via VIX is below 13, which is lowest reading in over 3 years. That among other factors, prompting people to think that the Top is at hand. Fools. Vol can stay low for months and years, infact it did so in 2004 (or there-about), creating a treacherous short squeeze, low-volatility advance - an essence of long-term bull market.
Low VIX is not an actionable trading signal. Based on this chart, VIX is at historically "normal" level.

So what do I do on Wall Street when Volatility Dead?
Ongoing project to make lists of ETF grouped by industry or affiliation:
(concept still not clear)
http://stockcharts.com/freecharts/candleglance.html?$NYA,$SPX,$COMPQ,IWM,QQQ,eem,$TNX,TBT,GLD,SLV,USO,AAPL|B|P5,3,3
http://stockcharts.com/freecharts/candleglance.html?$CRX,XLU,XLE,OIH,$XNG,GDX,$RXH,XRT,IBB,$XBD|B|P5,3,3
http://stockcharts.com/freecharts/candleglance.html?$SPX,$COMPQ,$NIKK,EWJ,EEM,FXI,EWS,EWM,EWH,IFN,vnm|B|E6,12,9
http://stockcharts.com/freecharts/candleglance.html?REMX,REE,LIT,URA,NLR,KOL,MOO,PHO,PIO,TAN|B|P5,3,3
Main 1. This one makes sense. Not sure of GCC. Need commodities futures index, but not sure of equal weight or like CRB ?
http://stockcharts.com/freecharts/candleglance.html?$NYA,$SPX,$COMPQ,QQQ,IWM,EFA,EEM,$TNX,UUP,GLD,USO,GCC|B|P5,3,3
Main 2. Don't like this list. Need to think
http://stockcharts.com/freecharts/candleglance.html?spy,dvy,lqd,hyg,tlt,tbt,dba,gld,slv,ige,$cex,ibb|B|P5,3,3
Biggest on Wall-street. Sum of market caps is little over 3 Trillion ! "Mighty Dozen"? Giant Dozen?
Surprisingly, not only they (as a group) do not outperformed SPX , they are not very much correlated to SPX either. All, except Buffett and PTR are part of S and P 500.
Note: I included PetroChina, because it's #3 in the world now, otherwise I decided to stick with good 'ol USofA. Used market cap data for BRK/A, included B-shares for ease of use.
I am going to make a chart in Excell. Average closing prices, throw in a couple MA's and see what happens.
http://stockcharts.com/freecharts/candleglance.html?spy,aapl,xom,wmt,goog,ge,msft,cvx,ibm,jnj,ptr,brk/b|B|P5,3,3
Very strong housing and real estate sector:
http://stockcharts.com/freecharts/candleglance.html?$SPX,FSHOX,XHB,ITB,IYR,VNQ,ICF,RWX,RWO,DRV,SRS|B|P5,3,3
Technology. Not sure of this selection, I made this list awhile ago. Why is EWX here?
http://stockcharts.com/freecharts/candleglance.html?XLK,IYW,VGT,EWX,SMH,IGV,IXN,FDN,IYZ,GSVC,socl|B|P5,3,3
Commodities (not finished)
http://stockcharts.com/freecharts/candleglance.html?$CRB,$CCI,DBA,DBC,IGE,GCC,$CRX|D
GCC=CCI (equal weight 17 futures); DBC=CRB? ; CRX is a commod based stocks
Friday, January 18, 2013
Positions, Market Conditions
Positions: (75% in, all long stocks, 1 short bonds (TBT))
http://stockcharts.com/freecharts/candleglance.html?IWM,EEM,XLU,$CEX,XHB,CG,TSLA,FB,JJG,NIB,TBT,scty|B|P5,3,3
$CEX, XLU are for tracking intraday for FIUIX, FSCHX
IWM, EEM, Chemicals and Utilities are 2x positions. SCTY is 1/2pos.
http://stockcharts.com/freecharts/candleglance.html?slx,kol|B|P5,3,3
Molecool:
I would be extremely interested in taking in short position if price would show any signs of weakness. (italics are his)
Doc Barter:
we are overbought and OT will increase short position from 5% to 10% on Friday, 18th of January 2013. We do NOT suggest to enter any of those and rather advise readers to increase cash. That being said, we are entering those shorts and OT has the patience to hold them.
His shorts: EDZ, EUM (emer mrkts), TWM (R2K), SMN (basic mat) , DAX puts, IYT short, index shorts (?), financial shorts
http://stockcharts.com/freecharts/candleglance.html?EDZ,EUM,TWM,SMN,faz,sds,qid|B|P5,3,3
Howard Lindzon:
While we pat ourselves on the back for being long...remember it's a bull market doing the work mostly and to 'Sell When You CAN!' $$
Almanac / Jeff Hirsch:
January Expiration Day, Dow Down 10 of Last 14 With Big Losses, Off 2.1% in 2010, Off 2.0% in 2006 and 1.3% in 2003
Beyond the obvious reasons, a positive January is much better than not as every down January on the S&P 500 since 1938, without exception, has preceded a new or extended bear market, a 10% correction, or a flat year whereas positives January’s preceded full-year gains 89.4%.
Cobra:
Likely we’ll see a red SPX tomorrow. I’ve already presented enough evidences in today’s Trading Signals, so no more blah blah here.
I see 2 more signals arguing for a top, so maintain the call for a sizable pullback.
Cara:
I am not calling it the "end game" because the rally will be over. I am calling it the "end game" because the analysis is nearing an end, proving to be correct as it ran right up to the estimated price area - we will need to evaluate price action when it does.
Zentrader: (finally I found somebody bullish)
Jeff Pierce - My market timing signal turned bullish on 1/4 for the Nasdaq and subsequently my others for Dow and TSX have flipped as well. I’m firmly in the bull camp at this point and expect a slow grind higher. – Bullish
ChessNwine:
The current rally is frustrating to many traders caught out of position, and the grind higher with an underlying sector rotation has added to the frustration of those missing the mark. At any rate, the price action in 2013 has thus far been defined by a rally, high and tight consolidation, and secondary push higher with underlying sector rotation. On its face, that action is bullish even as the S&P closes in on the 1500 level and devastating resistance from 2000 and 2007.
The Fly:
Make haste and get to the markets, for there is money to be made. Get your hands out from your vaginas and go get some. ...based upon recent history (I promise you older history looks the same), the market is in for some smooth sailing until late March.
Thursday, January 17, 2013
New High. 1480 on SPX. SCTY

1/17 - SCTY 14.60 half pos
Lyndon, Peter and "ma niga" Elon Musk managed to put together one helluva company.
No shit, this is actual picture from their website, and it gives me real pleasure to see young faces of their management team. I am a pretty good face reader, and I am smiling looking at these boys and girls.
http://www.solarcity.com/
No indicators, no support/resistance, no earnings, no price history.
Buying half
We had a spirited discussion about that here (link) :
itslance
Darth_Gerb, Incorrigible Iconoclast - Loyalist Leech
I'm sorry, but faces & money do not necessarily correlate IMNSHO.I reply:
I stand by my opinion, that management of SCTY are young, ambitious, driven young people. In finance it's bad, in service/manufacturing it is a combination that been changing the world thru-out history. Look up Elon Musk and see what he did, and what he set out to do.
Having said that, my stop is below most recent low, until further instructions
Then this:
Youth and exuberance is no match for age and treachery.
I answer (how do i come up with this shit?):
Fuck old people
World of the future belongs to young. Young of heart and mind. They don't know what is impossible, they don't know not to charge, they think they will never die... Do that and you will never grow old
(iBergamot grabs oxygen mask)
-------------------------------------------------------------------------
Something unusual happened yesterday: (wrote here):
Very narrow range on Nazdaq A/D.And so today SPX and IWM hit new highs. QQQ and Naz lagging.
Low -582; high -314. Negative all day long, thats no good.
Over past 6 months I only find 2 days with this narrow range. One end of August, one beginning of November. Both happened after a low vol sideways consolidation, both followed by explosive continuation of preceding trend.
Just one more piece of the puzzle
I am 75% invested, all long. YTD profit is little over 5%, and this is only 2 weeks of this year.
I really want to reflect, that on October 30, 2012 I wrote here (link):
My research shows a high amount of promising situations. Wide variety of great setups is presented. This type of situation happens couple of times a year at most. In the past, I only made aware of it when it's too late. Now I'm in it as it unfolds, already positioned in best and strongest areas...Well, it did happened just like I said. Unfortunately I wrote it when I was liquidating my fucking Flagship account, so no, no, I did not benefit from this knowledge. Subsequently and because of massive emotional breakdown, it took me good 2 months to get back on my feet. I promised myself not to dwell on this, and I wont, but this one time I will look back, acknowledge and move on.
Incidentally, I have a new plan and it's better than old one. May take a couple of years, but it will give me a sizable account to manage, so I can finally do it full time. It will be all mine, no investors, no partners.
Wednesday, January 16, 2013
Steel and Coal
BOT:
1/15 - SLX 49.07
1/15 - KOL 25.40
I first noticed Steel and Coal in summer 2012, when they started to surprisingly outperform. The idea was that presidential candidate was a friend of coal industry and there will be a favorable regulations.
Whatever it was, the guy lost, but SLX and KOL outperformed since November 2012 bottom.

It is even more important, because of steep downtrend in both since 2011 top. Prices had been consolidating for 8-9 months. Steel already broke out and I expect continuation.
SLX PF target 63; 72, but first its got to hold 47.5
KOL PF target 30; 33.50; 35. Bunch of supports, 24.50 is important.
Having said that, my stops are very close. These etf's are not in confirmed uptrend and can correct 10% easily, while still looking crazy bullish. In case I stop out I can try SLX again at 45-46ish.

Why not try to put together an industrial list?:
http://stockcharts.com/freecharts/candleglance.html?spx,xli,ige,slx,kol|B|P5,3,3
Monday, January 14, 2013
Cocoa, Coffee. Positions.
BOT:
1/10 - TBT @ 66.15
1/10 - EEM @ 44.70. Bought a final third, now it's a 2x pos and I don't want any more.
I wrote about TBT and EEM here (link) on 1/10/2013.
1/11 - NIB @ 30.74 (see below)
Positions:
http://stockcharts.com/freecharts/candleglance.html?IWM,EEM,XLU,$CEX,XHB,CG,TSLA,FB,JJG,NIB,TBT|B|P5,3,3
$CEX, XLU are for tracking intraday for FIUIX, FSCHX
IWM, EEM, Chemicals and Utilities are 2x positions.
Watch List:
http://stockcharts.com/freecharts/candleglance.html?SPY,GEO,KOL,SLX,IGE,TAN,SCTY,DRYS,UGA,ORB,GSVC,DDD|B|P5,3,3
http://stockcharts.com/freecharts/candleglance.html?SPY,XRT,XLE,XLB,remx,lysdy,EARH,$DJAKC,JO,JVA,XLV,IBB|B|P5,3,3
NIB tracks Cocoa pretty closely. Also $DJACC - cocoa sub-index.
Weekly looks ready for a bottom. Daily must not close below 30.
PF charts are a mess, as should be expected at turning point.
HalfATR chart points to that 30 mark, but traditional has bullish PO of 56 - about 2011 highs.
Now I also watch coffee.


UPDATE 1/17/2013:
What a mangled-fuck. I was looking at Dec 20 chart. Have to be more careful.
Anyway, analysis stays the same. Here is today's PF chart, showing Cocoa hitting 30 on the nose, bullish PO of 33.25, smaller HalfATR (bullish), and 30 mark as support.

On matters of FB :
The way it looks now, I'm not going to fight the turns. Will wait to see how reaction goes and maybe buy more. As of friday, FB was out of ALL BBands for 3 days. Gravity has to take hold. I hope it comes down a little so I can add. Something is cooking in there. Remember, this company is a worthless fraud. Right? Or so they said
Sunday, January 13, 2013
Bergamot T
I first notice this T back in October 2012 in this post (link). Although I called it Advance-Decline T, it's technically a McClellan Oscillator($NYMO) T.
Now i am no expert in T Theory, but from what I remember of work of late/great Terry Laundry this one is a finely brewed Bergamot T. His famous Advance-Decline(A/D) Oscillator looked really really similar to NYMO, and since he never revealed how exactly he calculated the thing, well, NYMO it is.
 Traditionally, T has a centerpost at A/D split double-bottoms. The problem with this is that Nov 15 and Dec 28 bottoms may be too far apart, not only in time but also in price level of NYMO. Even forget about oscillator, SPX hardly looks like double-bottom. All that aside it projects into summer 2013, which is entirely possible.
Conservatively, T starts at left bottom, and since it is no doubt a V-bottom on SPX and extreme reading on NYMO - here you go - rally into spring. T End Date will be sometime in April, I will figure out the date when we get there.
Overall it looks like the same scenario as two previous years - ramp into spring, summer range, double or multiple top and crush.
More tea, dear Sir?
Now i am no expert in T Theory, but from what I remember of work of late/great Terry Laundry this one is a finely brewed Bergamot T. His famous Advance-Decline(A/D) Oscillator looked really really similar to NYMO, and since he never revealed how exactly he calculated the thing, well, NYMO it is.

Conservatively, T starts at left bottom, and since it is no doubt a V-bottom on SPX and extreme reading on NYMO - here you go - rally into spring. T End Date will be sometime in April, I will figure out the date when we get there.
Overall it looks like the same scenario as two previous years - ramp into spring, summer range, double or multiple top and crush.
More tea, dear Sir?
Later that day we had a wonderful discussion here:
Darth_Gerb replied to
you
All very good. and I reviewed the old chart just to refresh.
The smallest T, ending soon, I fully agree with.
The descending NYMO highs created the thick brown line, and the plunge to -100 and resultant skyrocket up, created a break in that line, which defines a shift from accumulation to distribution.
The other two larger T's however nice, I disagree with and I'll share my opinion and what I've learned from Terry. The low near NewYears was not low enough. In fact it doesn't even qualify at -40. Go look at the earlier 2 year chart. only lows of -80 would I consider. Terry said, "if a low doesn't go low enough, then the rebound is weak, typically in creating a fail setup where there just isn't enough buyers and confidence to go higher."
The T into spring has a shot at being legit, but there is no guarantee where the price of SPX would be at that time. It would be something to jot down in your notes/calendar 'to keep an eye on'. Otherwise, you've got T theory in your blood.
-DG
Thursday, January 10, 2013
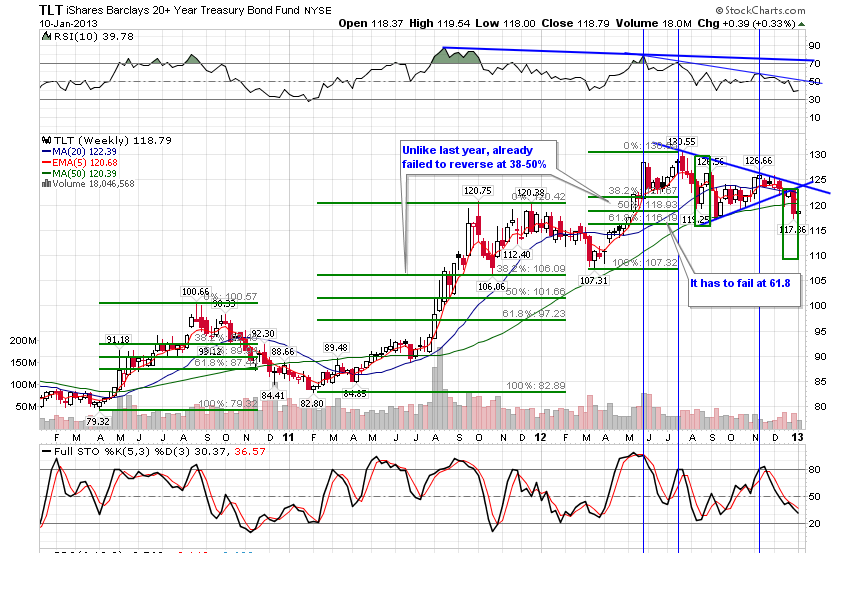
Possibility of Bond Bear Market
BOT: TBT @ 66.15, which was almost HOD. 65 is support. If broken there is gap fill at 63.50 and 50dma at 62. I want at least 2x pos short bonds, so the question is: do I hold for lower levels and add or step aside and start over at better prices?
I wrote in AM:
Looks like 30yr Bond breaking down from bear flag. Past this I don't see any support close by.
For me - TBT, cus I can't go short
TLT is better chart to analyze than TBT.
TLT 5Wema and 50Wma are around 120.20 and its a line in a sand. No weekly close above is allowed, otherwise its a repeat of spring 2012 again.
Volume profile weakening, but note that it was bad a year ago yet resulted in rally. The major difference is that now it is UNDER 200/50 DMA's. All PF targets are down at 113 to 108, so TBT going to 80-90


Added to EEM @ 44.70. So now I have a 2x pos with av cost 43.84
Just as I did it Doc Barter put out short emerging markets via EDZ :
http://www.objectivetrader.com/2013/01/emerging-markets-short-10th-of-january-2013.html
He is an excellent analyst, but his timing sometimes early
Tuesday, January 8, 2013
Positions, Watch List. 50% invested.
Positions: (50% invested)
http://stockcharts.com/freecharts/candleglance.html?IWM,EEM,XLU,$CEX,XHB,CG,TSLA,FB,jjg|B|P5,3,3
$CEX, XLU are for tracking intraday for FIUIX, FSCHX
Watch list:
http://stockcharts.com/freecharts/candleglance.html?spy,geo,kol,slx,ige,tan,scty,drys,uga,orb,gsvc,ddd|B|P5,3,3
BOT:
1/8 - JJG 51.98
1/4 - IWM 87.05 (2x pos)
1/3 - TSLA 35.40
1/3 - FB 28.13
On Monday 1/7/13 ES open interest actually went Down! Short-covering, like I haven't seen in a while.
I see 2.766mil cars on ES today and if people getting short it will show more tomorrow.
People are looking for some kind of top. Skynard thinks "Big boys are selling into this crap", and I don't want to second-guess this great day-trader. Well, that's easy. Is that a H&S on hourly with target in 1440ish? Looks to be testing neckline now: (I used somebody's chart - "fear" annotation is not mine)
 Only about a month ago I noted similar H&S (link) completed on 12/14/12, but didn't go to target and after initial break turned and went higher, only to collapse lower by end of December. What a cluster-fuck.
I actually made small profit in December, although I was mainly liquidating positions because of this Whipsaw notion. I will revisit this issue later, but visibly it was option #1 which later turned into cluster-fuck.
Can this all collapse now? I am not sure.
Trans (IYT) has been left for dead for months. Breakout.
R2K (IWM) had a monster rally, regardless of neg div, overbought etc. Breakout.
VIX, A/D and so on... all this is crazy bullish. And we didn't close the gap, we didn't even check that New-Year open yet. "Yet" is the key word here.
The way I see it, whatever correction we will get here - it has to be bought with reckless abandon. I will trade accordingly.
May be grains bottoming. Soybeans rolled into March contract and 1395ish is the level to watch.
Trying JJG again @ 52. I stopped out on 12/20 @ 52.76 at loss. It was a gap-down past my 54 stop. oops

http://stockcharts.com/freecharts/candleglance.html?IWM,EEM,XLU,$CEX,XHB,CG,TSLA,FB,jjg|B|P5,3,3
$CEX, XLU are for tracking intraday for FIUIX, FSCHX
Watch list:
http://stockcharts.com/freecharts/candleglance.html?spy,geo,kol,slx,ige,tan,scty,drys,uga,orb,gsvc,ddd|B|P5,3,3
BOT:
1/8 - JJG 51.98
1/4 - IWM 87.05 (2x pos)
1/3 - TSLA 35.40
1/3 - FB 28.13
On Monday 1/7/13 ES open interest actually went Down! Short-covering, like I haven't seen in a while.
I see 2.766mil cars on ES today and if people getting short it will show more tomorrow.
People are looking for some kind of top. Skynard thinks "Big boys are selling into this crap", and I don't want to second-guess this great day-trader. Well, that's easy. Is that a H&S on hourly with target in 1440ish? Looks to be testing neckline now: (I used somebody's chart - "fear" annotation is not mine)

I actually made small profit in December, although I was mainly liquidating positions because of this Whipsaw notion. I will revisit this issue later, but visibly it was option #1 which later turned into cluster-fuck.
Can this all collapse now? I am not sure.
Trans (IYT) has been left for dead for months. Breakout.
R2K (IWM) had a monster rally, regardless of neg div, overbought etc. Breakout.
VIX, A/D and so on... all this is crazy bullish. And we didn't close the gap, we didn't even check that New-Year open yet. "Yet" is the key word here.
The way I see it, whatever correction we will get here - it has to be bought with reckless abandon. I will trade accordingly.
May be grains bottoming. Soybeans rolled into March contract and 1395ish is the level to watch.
Trying JJG again @ 52. I stopped out on 12/20 @ 52.76 at loss. It was a gap-down past my 54 stop. oops

Monday, January 7, 2013
Marijuana
Weed is a 40 to 120 bil industry, meaning it's between pets and beer. But really nobody knows for sure. I had CBIS on my watch list for years, but that company is issuing shares at every ramp. Seems they are mostly mining the market, although theirs is the only independent medical research out there.This reminds me of how a Rare Earths started. Bunch of pink sheets and BB junk. Some will fail.
http://stockcharts.com/freecharts/candleglance.html?MDBX,CBIS,MJNA,HEMP,PHOT,AVTC,TRTC,ERBB,SRER,GRNH|B|P5,3,3
 Read this: http://seekingalpha.com/article/1084571-marijuana-industry-support-grows-2-stocks-to-own-if-it-hits?source=yahoo
One of comments:
http://www.thestreet.com/story/12153847/1/finra-blows-smoke-in-pot-warnings.html?puc=yahoo&cm_ven=YAHOO
http://www.huffingtonpost.com/2013/11/04/marijuana-market_n_4209874.html
http://www.rollingstone.com/politics/news/the-next-seven-states-to-legalize-pot-20121218
----------------------------------------------
UPDATE 1/9/2014
An interesting discussion was here: http://evilspeculator.com/?p=39899
Some of my comments:
MJ should never be illegal, for (many) reasons, but mainly because of Hemp. A wonder plant used to produce everything from fabric and paper to food and fuel, until it was made outlaw in 1930's. Incidentally, the most powerful congress lobby at that time where grain and cotton farmers (an equivalent of today's bankers and big oil). Conspiracy theory? Sure. Not if, but when we will be able to grow Hemp in USA again, farmland will go thru the roof, and nobody will be selling.
IMNSHO, legalization of harmless herb will do the same wonders for our economy, as legalization of alcohol did during Great Depression.

http://stockcharts.com/freecharts/candleglance.html?MDBX,CBIS,MJNA,HEMP,PHOT,AVTC,TRTC,ERBB,SRER,GRNH|B|P5,3,3

One of comments:
Some of these companies - I should actually say the management of these companies are bullshit. SRER for example, is not in the MJ business any longer. If you bought the stock because of weedmaps.com, well, they sold that for 3 million and are now looking at "opportunities in ..., tattoo parlors..." What did shareholders get from that sale? NADA! HEMP is out trying to give corporate finance 101 lessons in their press releases to justify their craptasticness after a series of spin offs that leaves shareholders with more or less nothing. A couple seem ok. PHOT seems to be legitimately trying to start a holding company of MJ businesses. TRTC has a couple decent sites for selling growing stuff. MDBX, AVTC are an interesting story but takes more nerve than i have to buy mdbx here. I think SRER, ERBB, HEMP are worthless; I'm on the fence with MJNA and CBIS; I Like: PHOT, TRTC, AVTC, MDBX, GWPRF, and possibly FSPM. Not real familar with GRNH.(UPDATE 12/17/2013)
http://www.thestreet.com/story/12153847/1/finra-blows-smoke-in-pot-warnings.html?puc=yahoo&cm_ven=YAHOO
http://www.huffingtonpost.com/2013/11/04/marijuana-market_n_4209874.html
http://www.rollingstone.com/politics/news/the-next-seven-states-to-legalize-pot-20121218
----------------------------------------------
UPDATE 1/9/2014
An interesting discussion was here: http://evilspeculator.com/?p=39899
Some of my comments:
MJ should never be illegal, for (many) reasons, but mainly because of Hemp. A wonder plant used to produce everything from fabric and paper to food and fuel, until it was made outlaw in 1930's. Incidentally, the most powerful congress lobby at that time where grain and cotton farmers (an equivalent of today's bankers and big oil). Conspiracy theory? Sure. Not if, but when we will be able to grow Hemp in USA again, farmland will go thru the roof, and nobody will be selling.
IMNSHO, legalization of harmless herb will do the same wonders for our economy, as legalization of alcohol did during Great Depression.

Saturday, January 5, 2013
Listen: Charlie Munger, Nassim Taleb, Chris Camillo
Charlie Munger in 2009, talks about idiot boom, false competitiveness, and Berkshire investment tricks.
Plain spoken, old school.
Nassim Taleb. Antigragility. the idea that through small shocks and surprises humans (and financial systems) can become more than robust – they can thrive and become antifragile.
http://nassimtaleb.org/
http://www.bloomberg.com/video/this-guy-turned-20k-into-2-million-you-can-too-piX08ijaQ7WeFEyhxEau8g.html
Self-Directed Investor Chris Camillo talks about "Crowd fund investing" ? I never heard about this.
Hey look, he even got himself a blog to pump his-n-hers investments
http://chriscamillo.com/blog
Plain spoken, old school.
Nassim Taleb. Antigragility. the idea that through small shocks and surprises humans (and financial systems) can become more than robust – they can thrive and become antifragile.
http://nassimtaleb.org/
Watch Author Nassim Nicholas Taleb on PBS. See more from Tavis Smiley.
http://www.bloomberg.com/video/this-guy-turned-20k-into-2-million-you-can-too-piX08ijaQ7WeFEyhxEau8g.html
Self-Directed Investor Chris Camillo talks about "Crowd fund investing" ? I never heard about this.
Hey look, he even got himself a blog to pump his-n-hers investments
http://chriscamillo.com/blog
Friday, January 4, 2013
Carlyle Group, take two.
BOT: CG @ 26.20 (1 full position - I want more hopefully at higher price and soon)
I was stopped out of Carlyle Group at the lows of last reaction here (link) and I said:
11/27 - (sell) CG on stop 24.95. Re-entry possible, just need to close over 25.50.
Well it did, and more. Need wider stop.
Some things are really strange. Company website has total shares 300mil, but float only 43mil. Can't find when and if more shares coming to market. SI is 1.5mil - that's 15 to 20 days to cover!
20mil shares (or half! the float) belongs to Hank Herrmann of Waddell & Reed and Ivy Funds. WASAX (link) is a mut fund that holds 8.8mil . WSJ has the most data on ownership here.
What is the connection between these people? Would David Rubenstein be worried that some dude holds half the shares. Do they trust each other so much? That I don't know, but from the chart I see that
25.50 area should hold any reaction, but I will give it extra day and 0.50 or more.
PF targets are all over the place - 29.20; 30.15; 31; 31.20.
Here are other PE firms. CG is not the strongest chart, but they are similar and look good.
http://stockcharts.com/freecharts/candleglance.html?spy,cg,kkr,apo,bx|B|P5,3,3
See the little faggot with the earring and the make-up
Yeah buddy that's his own hair
That little faggot got his own jet airplane
That little faggot he's millionaire
Wednesday, January 2, 2013
Happy New Year
1/2/2013
Boy, am I glad for taking early exit on my shorts on Monday. Sometimes it's better to be lucky...

12/31/2012
First I did this:
XHB is setting up nicely. Started a position with easy stop under today's low. BOT: 26.20
Than:
I am seriously considering to close my QQQ short early. That would be "breaking the rules", cus neither stop nor objective are hit.
And finally:
Out of shorts.
(Including SRS at loss, and final piece of ZSL. Silver short runner failed, but total profit from "Silver Bullet" that started on 12/14/2012 here is quick 8% in 2 weeks. Good)
Holiday or not, if this doesn't fail - we have a valid reversal. A/D, VIX, bonds - all in agreement.
IWM strong, homebuilders(XHB) lead, emerging markets (EEM) didn't even blink, retailers (XRT) reversing strongly. I thought post-Xmas retail is dead, guess not.
I'm not doing anything today, but SIL is the one to watch
The day is not over, lets see what she can do
12/27/2012
This is Santa Clause Rally. No?
O, I know. This is sideways consolidation, because of Cliff. No?
Short squeeze coming? With 2.7mil cars on ES - there are no bears to kill. No.
How about 100 Samurai aka QQQ. This chart is a BBands madness, but I see a brick wall resistance at 66 and no strong support.
Inflection point? It does't get any better than this. Yes.
Short via QID at the moment
Later that day I bought EEM @ 43.50 without any specific reason. It was just stronger than anything out there and I had too many shorts. I wrote here (link):
"Buying EEM. Stop under 43.
Lets see what she can do"
Subscribe to:
Posts (Atom)