Showing posts with label CI. Show all posts
Showing posts with label CI. Show all posts
Sunday, April 6, 2014
What's Up
------------------Internals Update-----------------------
Surprisingly, internals don't offer much insight into presently potentially dangerous situation.
Over 70% of S&P500 stocks are still bullish and above 50dma. It doesn't tell the future, only present conditions.
MADI is still above 0, while Nasdaq A/D indicator is much weaker and already spent some time below 0 in March. Confidence Indicators are just in a sideways noise. Golden Indicator is surprising - it was advancing strongly in second half of March, I am really curious at what it will do next. SPX under-performing the world and especially Emerging, but it doesn't last long in recent months.
-----------------------------------------------------------
It strongly feels to me that market is falling apart, everything will get hit, leading to much-much lower levels on popular indexes. Small caps (via IWM) and Nasdaq stocks in general are weaker than large caps, represented by Dow and S&P, but I want to focus on S&P500 for several reasons.
I studied major averages going back over 100 years. There is no dependable set of rules that would enable a person to ride every zig and zag. On a top of that they keep changing the rules of how indexes composed and calculated. That cockamamie S&P500 index is calculated based on publicly available float, which is misleading number, and then there is a divisor (o, statistics). Historically index moves up and down 10 to 30 percent at a clip without rhyme or reason, and can go for over 20 years in a wide range without any noticeable progress or just rip endlessly higher for years. We seemed to be in a former up until last year. As I pointed out back in early 2013 (link): "Sure, we can learn from history, but not as much as you think."
There is an unusual divergence in performance of growth VUG vs value VTG stocks, over a recent couple of months. Value out-performance is uncommon, as growth stocks are market leaders most of the time. So much so that 90's crazy bull market was all growth, while value was killed and many good companies in their own mini-bear market, even with averages ripping higher.
Lets assume for a second that miscreants from McGraw Hill are actually doing a good job (for index that is) and that ,based on Dow Paradox (link), "The purposeful manipulation of index components is designed to produce positive outcome, thus creating an upward equity slope". Then it would be possible to find good, profitable, growing companies, that are also in up-trend, among S&P 500 index components. These type of stocks should be something similar to System12 components, as this is how a company becomes one of Mega Dozen (MD) - grow to become The Biggest. The bottom of the barrel should be exactly the opposite - a prime candidate for short before these lagging dullards are dropped from index (and especially after).
OTOH, I am looking for new emerging Theme, not based on my own opinion (which is usually correct, but badly timed), but on price action and fundamentals of present market leaders. The trick is to find a Theme that is emerging from years/months of basing, so I can 'buy low - sell high'; and at the same time the one that is already moving on daily/weekly, so I can 'buy high - sell higher'. This is an epitome of System9.
---------------------------In The News----------------------------
The biggest unreported news is a string of at-least 12 suicides of high level financial services executives around the globe. Tragic and not comical at-all, the story is custom made to fit any popular conspiracy theory. I wonder why nobody seems to step forward?
http://www.zerohedge.com/news/2014-04-05/abn-amro-ex-ceo-found-dead
JP Morgan, Deutsche Bank, Swiss Re, ABN Amro etc. Clean-up or damage control...he-he
Wednesday, February 5, 2014
My A/D Indicator and Internals Update
Over past few days I stopped out of almost all common stock holdings, except gold, silver, miners, pot (in LB account), utilities and couple of other things. I don't have any shorts on. System 9 is over 50% cash, account continuously pushing new equity highs. System11 had a streak of winning trades, even thou I trade it sporadically and missed most of good opportunities. System12 stalled (as it should in correction) with only 4 positions so far.
I am crazy busy at work, as my departure nears. Already started to train my replacement - she is very bright - hope she doesn't quit before I leave...lol
I will be cashing out most of marijuana stocks from Z account, in order to pay for Boichik trip to Italy next year. Only a few months ago it seemed absolutely impossible. This is a great news, and a major achievement for me - to make and withdraw a significant amount of money from the market!
I feel very proud. Remember Ibiza - The Impossible Dream... Will happen someday too...
-------------------------------------------------------------------------
I started to get ideas about how to use My A/D Indicator (MADI) about a year ago in this Internals Study (link). Since then I added and changed few things. First of all, I now mostly use NYSE Advace/Decline issues (NYAD), because it seems to produce cleaner signals, but still look to Nasdaq (NAAD) for confirmation. Sometimes they diverge - I don't know what it means.
This is what now are MADI Rules for Bull Market ( I suspect that bear market will produce different levels, but don't have data to test):
- When 20ema is under 0 - market is consolidating or falling. Bottom will be made before 20ema recovers above 0.
- When NYAD 20ema goes below -200, and doesn't recover quickly, - it will go lower and produce at-least a tradable bottom at much lower levels. Most common next level is -400 to -600. Note that August 2011 bottom was -900 on 20ema! This spike lower will get a retest most of the time.
- When NYAD 50ema goes to or below -200, then its a Just Buy The Fucking Dip (JBTFD). This seems to be the most reliable use of MADI. Buyable dip happens couple of times every year, usually followed by second dip of indicator 2 weeks to 2 months after extreme reading of -200 (or less) on 50ema of Advance/Decline issues. Failure of this bottom may lead to mini-crash (this is what happened in 2011)
- In order for bottom to be complete 20ema has to rally fast and recover above 0.
- In a bull market, MADI will spend more time above 0, allowing to keep positions longer and add on dips.
- "Sell The Rip" is generally at NYAD 20ema +400, but can go to +600/+700. As it is, its not a good signal to short the market - several of these high readings where just run over in early 2013. I'd say - when indicator is that high, probably too late to buy.
3 year study of MADI is here (link)
----------------------------------------------------------
T-Theory Volume Oscillator checked at -80, the reading usually associated with tradable bottom. It may be already double bottomed. Unfortunately it may have destroyed T12/2013 (from this post link). I will wait for a rally, to see if market really bottomed, and revisit T-Theory then.
Confidence Indicator dumped, treasuries are a place to be since the beginning of the year, investment grade corporate bonds are better than high yield junk (no shit).
Golden Indicator warning that shocks are weak, although S&P and developed markets are stronger than Emerging.


-----------------------------------------------------------
http://www.zerohedge.com/news/2014-02-04/marc-faber-fears-vicious-circle-downside-just-beginning
Mark Faber warning again. Treasuries are the place to be for next 3-6 months. I already have VUSTX in System 1 account, not looking to add for now.
-----------------------------------------------------------
Nadeem_Walayat see ..."No sign whatsoever that this bull market is anywhere near being over!"
"THIS stocks stealth bull market is one of the GREATEST bull markets in HISTORY!"
"The current stock market correction looks set to attempt to revisit 15,000. How close it gets to 15,000 I can't tell, perhaps half way, just that the correction is not done to the downside."
His favorite sector is Biotech, and has been forawhile.
http://www.marketoracle.co.uk/Article44238.html
-----------------------------------------------------------
http://www.zerohedge.com/contributed/2014-01-23/roubini-many-davos-speakers-think-it%E2%80%99s-1914-%E2%80%A6-right-ww1-broke-out
Classic ZeroHedge. The world is ending...again...any day now...
------------------------------------------------------------
Weekly Nasdaq A/D Cumulative
http://stockcharts.com/h-sc/ui?s=$NAAD&p=W&yr=3&mn=0&dy=0&id=p03531550066
My A/D Indicator (NYSE) with BPSPX and SPXA50R
http://stockcharts.com/h-sc/ui?s=$NYAD&p=D&yr=2&mn=0&dy=0&id=p24055471029
McClellan Suite: NYMO; NYSI; NAMO
http://stockcharts.com/h-sc/ui?s=$NYMO&p=D&yr=1&mn=0&dy=0&id=p04197492070
T-Theory Volume Oscillator
http://stockcharts.com/h-sc/ui?s=$NYUD&p=D&yr=1&mn=0&dy=0&id=p81565637438
Risk-on /Risk-off ratios, aka Confidence indicator (FAGIX:VUSTX; HYG:LQD; $SPX:$USB)
http://stockcharts.com/h-sc/ui?s=FAGIX:VUSTX&p=D&yr=1&mn=0&dy=0&id=p43022938657
Golden Indicator with World Ratios
http://stockcharts.com/h-sc/ui?s=$SPX:$GOLD&p=D&yr=1&mn=0&dy=0&id=p51708175586
----------------------------------------------------------
http://ibergamot.blogspot.com/2013/12/new-t-and-internals-update.html
http://ibergamot.blogspot.com/2013/09/internal-indicators.html
http://ibergamot.blogspot.com/2013/04/internals-study.html
------------------------------ In The News ----------------------------
Solar activity is productive with M-class flares every day. "Solar activity is expected to be at moderate levels with a chance for high levels through 09 February", sais NOAA.
Now we have a new Fed Chairman(woman). Bermonkey is no more. Good riddance.
Emerging markets are submerging again. Turkey, Argentine, Brasil, South Africa, bunch in Asia, etc are in some kind of currency crisis. China got banking problems. I am looking to buy the blood.
Here is very smart India central bank Governor Raghuram Rajan talks about interest rates, fund outflows, the rupee and global monetary policy coordination on Jan 30.
-------------------------------------------------------------------------
I am crazy busy at work, as my departure nears. Already started to train my replacement - she is very bright - hope she doesn't quit before I leave...lol
I will be cashing out most of marijuana stocks from Z account, in order to pay for Boichik trip to Italy next year. Only a few months ago it seemed absolutely impossible. This is a great news, and a major achievement for me - to make and withdraw a significant amount of money from the market!
I feel very proud. Remember Ibiza - The Impossible Dream... Will happen someday too...
-------------------------------------------------------------------------
I started to get ideas about how to use My A/D Indicator (MADI) about a year ago in this Internals Study (link). Since then I added and changed few things. First of all, I now mostly use NYSE Advace/Decline issues (NYAD), because it seems to produce cleaner signals, but still look to Nasdaq (NAAD) for confirmation. Sometimes they diverge - I don't know what it means.
This is what now are MADI Rules for Bull Market ( I suspect that bear market will produce different levels, but don't have data to test):
- When 20ema is under 0 - market is consolidating or falling. Bottom will be made before 20ema recovers above 0.
- When NYAD 20ema goes below -200, and doesn't recover quickly, - it will go lower and produce at-least a tradable bottom at much lower levels. Most common next level is -400 to -600. Note that August 2011 bottom was -900 on 20ema! This spike lower will get a retest most of the time.
- When NYAD 50ema goes to or below -200, then its a Just Buy The Fucking Dip (JBTFD). This seems to be the most reliable use of MADI. Buyable dip happens couple of times every year, usually followed by second dip of indicator 2 weeks to 2 months after extreme reading of -200 (or less) on 50ema of Advance/Decline issues. Failure of this bottom may lead to mini-crash (this is what happened in 2011)
- In order for bottom to be complete 20ema has to rally fast and recover above 0.
- In a bull market, MADI will spend more time above 0, allowing to keep positions longer and add on dips.
- "Sell The Rip" is generally at NYAD 20ema +400, but can go to +600/+700. As it is, its not a good signal to short the market - several of these high readings where just run over in early 2013. I'd say - when indicator is that high, probably too late to buy.
 |
| MADI 2/2014 |
----------------------------------------------------------
T-Theory Volume Oscillator checked at -80, the reading usually associated with tradable bottom. It may be already double bottomed. Unfortunately it may have destroyed T12/2013 (from this post link). I will wait for a rally, to see if market really bottomed, and revisit T-Theory then.
Confidence Indicator dumped, treasuries are a place to be since the beginning of the year, investment grade corporate bonds are better than high yield junk (no shit).
Golden Indicator warning that shocks are weak, although S&P and developed markets are stronger than Emerging.
-----------------------------------------------------------
http://www.zerohedge.com/news/2014-02-04/marc-faber-fears-vicious-circle-downside-just-beginning
Mark Faber warning again. Treasuries are the place to be for next 3-6 months. I already have VUSTX in System 1 account, not looking to add for now.
-----------------------------------------------------------
Nadeem_Walayat see ..."No sign whatsoever that this bull market is anywhere near being over!"
"THIS stocks stealth bull market is one of the GREATEST bull markets in HISTORY!"
"The current stock market correction looks set to attempt to revisit 15,000. How close it gets to 15,000 I can't tell, perhaps half way, just that the correction is not done to the downside."
His favorite sector is Biotech, and has been forawhile.
http://www.marketoracle.co.uk/Article44238.html
-----------------------------------------------------------
http://www.zerohedge.com/contributed/2014-01-23/roubini-many-davos-speakers-think-it%E2%80%99s-1914-%E2%80%A6-right-ww1-broke-out
Classic ZeroHedge. The world is ending...again...any day now...
------------------------------------------------------------
Weekly Nasdaq A/D Cumulative
http://stockcharts.com/h-sc/ui?s=$NAAD&p=W&yr=3&mn=0&dy=0&id=p03531550066
My A/D Indicator (NYSE) with BPSPX and SPXA50R
http://stockcharts.com/h-sc/ui?s=$NYAD&p=D&yr=2&mn=0&dy=0&id=p24055471029
McClellan Suite: NYMO; NYSI; NAMO
http://stockcharts.com/h-sc/ui?s=$NYMO&p=D&yr=1&mn=0&dy=0&id=p04197492070
T-Theory Volume Oscillator
http://stockcharts.com/h-sc/ui?s=$NYUD&p=D&yr=1&mn=0&dy=0&id=p81565637438
Risk-on /Risk-off ratios, aka Confidence indicator (FAGIX:VUSTX; HYG:LQD; $SPX:$USB)
http://stockcharts.com/h-sc/ui?s=FAGIX:VUSTX&p=D&yr=1&mn=0&dy=0&id=p43022938657
Golden Indicator with World Ratios
http://stockcharts.com/h-sc/ui?s=$SPX:$GOLD&p=D&yr=1&mn=0&dy=0&id=p51708175586
----------------------------------------------------------
http://ibergamot.blogspot.com/2013/12/new-t-and-internals-update.html
http://ibergamot.blogspot.com/2013/09/internal-indicators.html
http://ibergamot.blogspot.com/2013/04/internals-study.html
------------------------------ In The News ----------------------------
Solar activity is productive with M-class flares every day. "Solar activity is expected to be at moderate levels with a chance for high levels through 09 February", sais NOAA.
Now we have a new Fed Chairman(woman). Bermonkey is no more. Good riddance.
Emerging markets are submerging again. Turkey, Argentine, Brasil, South Africa, bunch in Asia, etc are in some kind of currency crisis. China got banking problems. I am looking to buy the blood.
Here is very smart India central bank Governor Raghuram Rajan talks about interest rates, fund outflows, the rupee and global monetary policy coordination on Jan 30.
-------------------------------------------------------------------------
Friday, December 27, 2013
New T and Internals Update
Right next to it is new Volume Oscillator T12/2013. I think that shorter blue VOT12/2013 is a correct one, but reliability of this analysis is questionable, T-Theory had alot of misses lately as i noticed back in September in this post (link).


A completely different look at Volume Oscillator weekly plot. Everything is different here
 |
| W VO T 2013 |
In this post (link) back in May 2013 I plotted VOT 8/2011 with 1 year cash build up (series of lower highs and lower lows on Volume Oscillator), with multiple touches of down-sloping trendline and bull trap. Very similar to this VOT 6/2013.
 |
| VO T 6/2013 |
Top? This is what I wrote 2 days before top on May 20: "Mostly all of internal divergences are gone, and aside from everything being overbought and obnoxiously bullish - there are absolutely no indication of immediate market top." I also laid out my case for being a Perma Bear in the same post (link). All the while I was holding hedge of at-least 3X position size short via SDS, QID, HDGE, which end up costing me most of spring profits from longs. On May 22 I was 70% invested (post (link)
This year changed the way I think and trade in more ways than one. No one can successfully manage Kapital, while having this type of mush on a brain. Sucker...
-----------------------------------------
Weekly Nasdaq A/D Cumulative (mentioned above)
http://stockcharts.com/h-sc/ui?s=$NAAD&p=W&yr=3&mn=0&dy=0&id=p03531550066
My A/D indicator (NYSE) with BPSPX and SPXA50R
http://stockcharts.com/h-sc/ui?s=$NYAD&p=D&yr=1&mn=0&dy=0&id=p39294453226
McClellan Suite: NYMO; NYSI; NAMO
http://stockcharts.com/h-sc/ui?s=$NYMO&p=D&yr=1&mn=0&dy=0&id=p04197492070
T-Theory Volume Oscillator
http://stockcharts.com/h-sc/ui?s=$NYUD&p=D&yr=1&mn=0&dy=0&id=p81565637438
Risk-on /Risk-off ratios, aka Confidence indicator (FAGIX:VUSTX; HYG:LQD; $SPX:$USB)
http://stockcharts.com/h-sc/ui?s=FAGIX:VUSTX&p=D&yr=1&mn=0&dy=0&id=p43022938657
Golden Indicator with World Ratios
http://stockcharts.com/h-sc/ui?s=$SPX:$GOLD&p=D&yr=1&mn=0&dy=0&id=p51708175586
http://ibergamot.blogspot.com/2013/09/internal-indicators.html
http://ibergamot.blogspot.com/2013/04/internals-study.html
---------------------------------------------

Monday, April 29, 2013
Internals Study
I am attempting (again) to organize a wide array of market internal indicators I use. The problem is - i have them set-up differently at home, at work and at house-by-the-lake. I still refuse to sigh-up for any subscription, including one to Stockcharts-dot-com, where I would be able to keep them set in their Public Lists. So i need to make them compact, and get rid of weak ones.
Here is another problem: T-Theory Volume Oscillator (18,36MACD of $NYUD) is very confusing to me, especially so when using for T's. I thought its a dead end, but then realized that Im looking at "nested T" - small Volume Oscillator T with center-post at February 25th dip. VO T 2/2013 is about to ran out. Also on same chart: T 11/2012 is the same as BergamotT, but unlike NYMO, Volume Oscillator had a high in mid June and T projected right into Tax-day (give or take a day or two). Green "Irregulat T 4/2013" is missing secondary cash build-up phase and i don't know what to make of it.


This is all fine with benefit of hindsight, and seems to support endless rotation in sectors of S&P. This rotation is increasingly hard to predict and makes for very unhealthy environment, as evident by Confidence Indicator (FAGIX:VUSTX below) still diverging from S&P. This non-confirmation is already big enough, but can get bigger. Golden Indicator also diverging, but this configuration is very unreliable and I decided to ignore it for few weeks/months.
 Two studies below deal with Advance/Decline analysis.
McClellan Oscillator ($NYMO) is basically 19,39 MACD of Net Advances, the number of advancing issues less the number of declining issues on NYSE. I don't know what to make of it at this time, except that its pushing upper BBand, but at relatively low level. Percent of S&P stocks below 50MA shows a well pronounced divergence, as more and more stocks cannot get above their 50day MA. I wasn't watching Utilities, Staples and Healthcare that rallied strongly over past few months, and my watch-lists show disproportionate share of stocks that broke below 50MA and even already in their own bear market. Bullish Percent Index is similar, normally it lags by a month or two.
-----------------------------------------------------------------------------
My Nasdaq A/D Indicator deals with Net Advances in more straightforward way. Its simply 5day EMA and 20day MA of $NAAD. Shaded area are periods when 20day MA is below 0, during which IWM is weak, and its coming back above 0 right now. Also significant lows where made on lower readings of 20dma than most recent in April. Divergence is visible since beginning of the year, and lately it also shows up in weakness of Nasdaq New High / New Low since March.


Here is another problem: T-Theory Volume Oscillator (18,36MACD of $NYUD) is very confusing to me, especially so when using for T's. I thought its a dead end, but then realized that Im looking at "nested T" - small Volume Oscillator T with center-post at February 25th dip. VO T 2/2013 is about to ran out. Also on same chart: T 11/2012 is the same as BergamotT, but unlike NYMO, Volume Oscillator had a high in mid June and T projected right into Tax-day (give or take a day or two). Green "Irregulat T 4/2013" is missing secondary cash build-up phase and i don't know what to make of it.


This is all fine with benefit of hindsight, and seems to support endless rotation in sectors of S&P. This rotation is increasingly hard to predict and makes for very unhealthy environment, as evident by Confidence Indicator (FAGIX:VUSTX below) still diverging from S&P. This non-confirmation is already big enough, but can get bigger. Golden Indicator also diverging, but this configuration is very unreliable and I decided to ignore it for few weeks/months.

McClellan Oscillator ($NYMO) is basically 19,39 MACD of Net Advances, the number of advancing issues less the number of declining issues on NYSE. I don't know what to make of it at this time, except that its pushing upper BBand, but at relatively low level. Percent of S&P stocks below 50MA shows a well pronounced divergence, as more and more stocks cannot get above their 50day MA. I wasn't watching Utilities, Staples and Healthcare that rallied strongly over past few months, and my watch-lists show disproportionate share of stocks that broke below 50MA and even already in their own bear market. Bullish Percent Index is similar, normally it lags by a month or two.
-----------------------------------------------------------------------------
My Nasdaq A/D Indicator deals with Net Advances in more straightforward way. Its simply 5day EMA and 20day MA of $NAAD. Shaded area are periods when 20day MA is below 0, during which IWM is weak, and its coming back above 0 right now. Also significant lows where made on lower readings of 20dma than most recent in April. Divergence is visible since beginning of the year, and lately it also shows up in weakness of Nasdaq New High / New Low since March.


So I'm asking myself: Whats the bottom line? Really don't know, with so many negative divergences and internal weakness in SPX, Nasdaq, IWM etc, still market is not breaking down. In fact NYMO and My Naz A/D Indicator (MNA/DI) have room to upside and can support a 5-10% rally on major averages from here and last into end of May (if Irregular T 4/2013 works out).
---------------------------UPDATE-------------------------
Following this post, Market rallied 6-7% and peaked on May 22.
Pretty good analisys....ha-ha
----------------------------------------------------------------
At last here are two charts I watch intraday. The main version of MNA/DI and VIX. Volatility Index (VIX) looks really strange lately and I give it very little attention.


At close inspection I realized that I use 20 day Exponential MA on MNA/DI and tried to quickly redraw shaded areas in same manner as chart above. I will double check again tonight.

Thursday, April 18, 2013
Market Condition
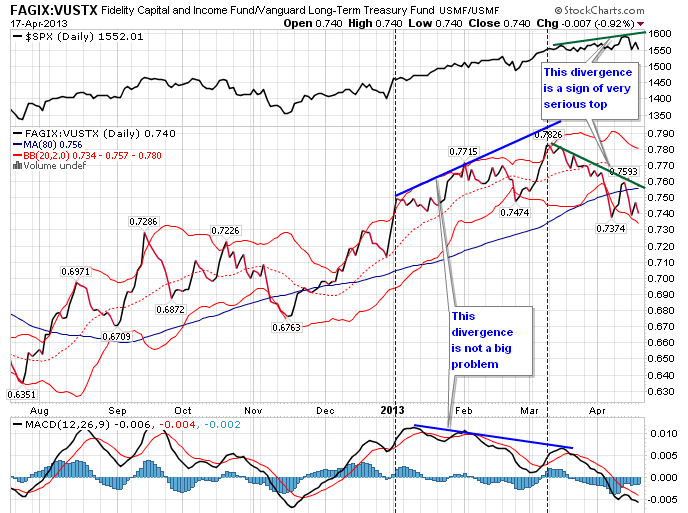
Confidence Indicator (CI) popularized by late great Terry Laundry.He had a whole theory behind how and why it works, tested and researched for many years. The way I use it is simply a ratio of High Yield Bonds overweighted in Technology to Treasuries 15/25 years to maturity. Risk on / risk off so to say. It has an excellent success rate for divergences of this ratio to
S&P500 leading to significant downside in Equities, just like what
it has now. Present divergence in price was preceded by internal weakness of indicator itself, as evident by MACD divergence.
 Bunch of other divergences present itself. New High to New Low Ratio gone negative for the first time this year. Less than half of S&P500 stocks are above 50DMA (per $SPXA50R). This is with SPX only about 3% off the highs! Also a deterioration is visible since March
 Small caps and Naz100 are weak and leading down. Financials XLF dipped below 50DMA ahead of SPX.
Naz A/D indicator is very weak.
................................................................................................................
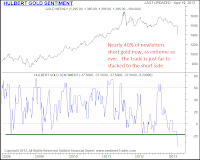
April 19 GOLD Sentiment
40% of newsletter writers recommend shorting Gold - this is most bearish since 2008
April 18 GOLD - Physical demand
The U.S. Mint in April has sold 153,000 ounces of American Eagle gold coins, the highest in almost three years, after futures prices started the week by plunging the most since 1980.
Sales have more than doubled from March and surged sevenfold from a year earlier, data on the Mint’s website showed. The amount for all of May 2010 was 190,000 ounce.
This week, retail sales and jewelry demand soared in India, the world’s top gold buyer, and China, the second-biggest, after futures in New York slumped into a bear market, touching the lowest in more than two years. Coin sales also surged in Australia.
April 17 GOLD
CME Hikes Gold, Silver Margins By 18.5%. Only big boys are allowed to play.
April 15, 2013 Monday. GOLD falls $150 to low 1335 (close 1361). Half of that drop happened overnight before US market opened. Volume 657090 cars !!! Highest volume of that day came shortly after open, as gold broke 1400
April 14 GOLD - HFT


The implication is that HFT bots driving gold down. They are perfectly designed to chew through bid structures, and that's what you see above. They are 'digesting' all the orders that were still on the books for gold, to remove them so that lower and lower stops could be run. Charts and explanation are from http://www.peakprosperity.com/blog/81535/gold-slam-massive-wealth-transfer-our-pockets-banks
I had no idea that Gold is liquid enough to handle these machines.
April 12, 2013 Friday. GOLD falls $88 to 1501
Goldman Sachs now expects gold to fall to $1,450 an ounce by the end of the year; the company’s original forecast was around $1,810. By the end of 2014, the company believes the precious metal will falter even more, falling to $1,270. Goldman’s 12-month gold outlook also fell from $1,550 to $1,390. Goldman also cut its short-term outlook, cutting its three-month forecast from $1,615 to $1,530 an ounce.
COTTON
Beijing–through the China Cotton Association–has agreed to extend its stockpiling program of the commodity, and will renew cotton stockpiling from September 2013 to March 2014, with no upper limit on purchases.
...............................................................................................................
I will start to track some of the news. Not because it helps in routine trading. It doesn't. But because markets can't fall without some "shaking of the tree". News cycle has been very quite and benign ever since the beginning of the year, which is unnatural. I strongly believe that some of the news are in fact a "warning shot across the bow", something that changes the balance of things, but often understood only with benefit of hindsight. Still I remember very clearly that I saw right thru all the BS about Jerome Kerviel back in 2008. Kid was softly setup to take a fall for some 500 million in losses for Société Générale (SoGen is a europian equivalent of Goldman Sachs), allowing the bank to get out of massive position in US markets right before Sub-Prime crisis began.
The idea is to plot biggest news on a chart for future use.
In The News:
April 16
Letters containing deadly ricin poison received by Presidents office, some senators and judge. No casualties. Suspect apprehended 2 days later and appears crazy.
April 15 Boston Marathon Bombing. Chechen's involved.
April
North Korea threatens nuclear attack, severs ties with South Korea. TV is full of cartunish videos of their mid-20th Century army and rockets and that fat kid (Lil Kim). It did get people scared.
Congress coming back from vacation, get a budget from president that is bigger than before, shots down gun legislation. Starting to shake the news a bit.
Bitcoin bubble. 40 to 265 in days, than back to less than 80 in hours.
Japan announces that not only they will print money, but also buy bonds, stocks, ETF's and real estate for next 2 years.
Numerous announcements of local and other taxes going up. Cost of doing business is thru the roof.
Beginning of April - Bird Flu outbreak in China. Some people died. Human-to-human transmission suspected, but denied by Chinese authorities.
Beginning of March - Cyprus bank crisis. Bank holiday, depositors looted, bailout failed, followed by rumors of their gold reserve sales. Germany approved bailout on April 18

Naz A/D indicator is very weak.
................................................................................................................
April 19 GOLD Sentiment
40% of newsletter writers recommend shorting Gold - this is most bearish since 2008

April 18 GOLD - Physical demand
The U.S. Mint in April has sold 153,000 ounces of American Eagle gold coins, the highest in almost three years, after futures prices started the week by plunging the most since 1980.
Sales have more than doubled from March and surged sevenfold from a year earlier, data on the Mint’s website showed. The amount for all of May 2010 was 190,000 ounce.
This week, retail sales and jewelry demand soared in India, the world’s top gold buyer, and China, the second-biggest, after futures in New York slumped into a bear market, touching the lowest in more than two years. Coin sales also surged in Australia.
April 17 GOLD
CME Hikes Gold, Silver Margins By 18.5%. Only big boys are allowed to play.
April 15, 2013 Monday. GOLD falls $150 to low 1335 (close 1361). Half of that drop happened overnight before US market opened. Volume 657090 cars !!! Highest volume of that day came shortly after open, as gold broke 1400
April 14 GOLD - HFT
The implication is that HFT bots driving gold down. They are perfectly designed to chew through bid structures, and that's what you see above. They are 'digesting' all the orders that were still on the books for gold, to remove them so that lower and lower stops could be run. Charts and explanation are from http://www.peakprosperity.com/blog/81535/gold-slam-massive-wealth-transfer-our-pockets-banks
I had no idea that Gold is liquid enough to handle these machines.
April 12, 2013 Friday. GOLD falls $88 to 1501
Goldman Sachs now expects gold to fall to $1,450 an ounce by the end of the year; the company’s original forecast was around $1,810. By the end of 2014, the company believes the precious metal will falter even more, falling to $1,270. Goldman’s 12-month gold outlook also fell from $1,550 to $1,390. Goldman also cut its short-term outlook, cutting its three-month forecast from $1,615 to $1,530 an ounce.
COTTON
Beijing–through the China Cotton Association–has agreed to extend its stockpiling program of the commodity, and will renew cotton stockpiling from September 2013 to March 2014, with no upper limit on purchases.
...............................................................................................................
I will start to track some of the news. Not because it helps in routine trading. It doesn't. But because markets can't fall without some "shaking of the tree". News cycle has been very quite and benign ever since the beginning of the year, which is unnatural. I strongly believe that some of the news are in fact a "warning shot across the bow", something that changes the balance of things, but often understood only with benefit of hindsight. Still I remember very clearly that I saw right thru all the BS about Jerome Kerviel back in 2008. Kid was softly setup to take a fall for some 500 million in losses for Société Générale (SoGen is a europian equivalent of Goldman Sachs), allowing the bank to get out of massive position in US markets right before Sub-Prime crisis began.
The idea is to plot biggest news on a chart for future use.
In The News:
April 16
Letters containing deadly ricin poison received by Presidents office, some senators and judge. No casualties. Suspect apprehended 2 days later and appears crazy.
April 15 Boston Marathon Bombing. Chechen's involved.
April
North Korea threatens nuclear attack, severs ties with South Korea. TV is full of cartunish videos of their mid-20th Century army and rockets and that fat kid (Lil Kim). It did get people scared.
Congress coming back from vacation, get a budget from president that is bigger than before, shots down gun legislation. Starting to shake the news a bit.
Bitcoin bubble. 40 to 265 in days, than back to less than 80 in hours.
Japan announces that not only they will print money, but also buy bonds, stocks, ETF's and real estate for next 2 years.
Numerous announcements of local and other taxes going up. Cost of doing business is thru the roof.
Beginning of April - Bird Flu outbreak in China. Some people died. Human-to-human transmission suspected, but denied by Chinese authorities.
Beginning of March - Cyprus bank crisis. Bank holiday, depositors looted, bailout failed, followed by rumors of their gold reserve sales. Germany approved bailout on April 18
Subscribe to:
Comments (Atom)