First of all, there is this 3 year wide Nasdaq A/D T , that I've been watching for months and first wrote about here (link). Projected peak for NaADT11/2012 is late July - early August 2014.
Right next to it is new Volume Oscillator T12/2013. I think that shorter blue VOT12/2013 is a correct one, but reliability of this analysis is questionable, T-Theory had alot of misses lately as i noticed back in September in this post (link).
----------------------------------------------------
A completely different look at Volume Oscillator weekly plot. Everything is different here
W VO T 2013
I see a possibility, that 'misses' of T-Theory in 2013 are entirely my own doing. Trying to fit T's into every zig and zag of market. Looking for action. Degenerate Gambler! Volume trends are not a short term phenomenon, they take time, they can change, they are not constant. So I stepped back to try and see a damn forest.
In this post (link) back in May 2013 I plotted VOT 8/2011 with 1 year cash build up (series of lower highs and lower lows on Volume Oscillator), with multiple touches of down-sloping trendline and bull trap. Very similar to this VOT 6/2013.
VO T 6/2013
The center-post location is very different. Back in 2011 it was a very
sharp 20% drop that felt like real bear-market. Summer of this year was
nothing alike. I came into June'13 with sizable short position still under water and decided that "...market is not going down, so I have no business to hold shorts..." and became Non - Delta Neutral in this post (link). Then market went even lower. On OpEx day (link) I noted that :"All my A/D indicators are at "last stand" line. In recent past it led to hard V-type reversal." It did, although on June 25 (one day past the bottom) I was making parallels to 1987, noting "...how fast a pullback of a strong bull market
turns into failure..." in this post (link). It was a period of high solar activity and geomagnetic storms, economic news where good, all other news where bad, Obama fired Bermonkey on live TV, and $VIX went to 21. That was the bottom.
Top? This is what I wrote 2 days before top on May 20: "Mostly all of internal divergences are gone, and aside from everything
being overbought and obnoxiously bullish - there are absolutely no
indication of immediate market top." I also laid out my case for being a Perma Bear in the same post (link). All the while I was holding hedge of at-least 3X position size short via SDS, QID, HDGE, which end up costing me most of spring profits from longs. On May 22 I was 70% invested (post (link)
This year changed the way I think and trade in more ways than one. No one can successfully manage Kapital, while having this type of mush on a brain. Sucker...
Zhongguo is the most common (mandarin) name for China, it means "Middle Country"or something similar. Here are some quotes from internets:
Ancient Chinese believe that China is the center of the world, its in the middle of earth... Some Western writers use the translation "middle kingdom" or "central
kingdom" to imply that China has a deeply rooted self-centered
psychology as the center of the universe... The ancient Chinese believed that they are the only civilization on earth while being surrounded by barbarians...
5000 years of national history is quite a claim, for sure. Plus there is this:
Those assholes keep dissing Chinese, but they are the ones rocking made
in China versace and driving in China manufactured Cadillac
ZHONGGUO investing is a challenge in itself, and has been a dud for a past few years. Complains? Fuck you. Shanghai Composite Index ($SSEC) gained 6000% from 1990 to 2007, that is 60X your initial investment in less than 20 years, with plenty ups and downs to trade. Its resting now, but its not the first time its down 50% +. In a relatively short index history there where 2 such periods, lasting 4-6 years, followed by multi-year rip higher. Its not a question whether you will double your money, but how many times...
Below is a historical chart up to Dec'12. Notice - chart is log-scale !
Nothing much changed since then.
I've been keeping an eye on a situation for years, even mentioned it here in April'12 (link).
There are some regulatory changes that will be at work for a next year or two. Specifically, there really isn't a straight way to invest in SSEC - its a composite index comprises of all the A shares (traded in local currency) and B shares (in foreign currency) listed on the Shanghai Stock Exchange. Up until recently foreign investors where not allowed to go into 'inland' market. So we buy A-Shares listed in Hong-Kong (H-Shares), or go for N-Shares (Chinese companies listed in US market, but may or may not be incorporated in China), or other various layers of this particular scam.
All this may be changing soon, as foreign access to A listings controlled under the Qualified Foreign institutional investor (QFII) scheme, has been relaxed somewhat in 2012 and again in March 2013. It is expected that A-shares with increase in allocation by as much as 60% over next couple of years. In that process China will likely become 4th or 5th largest equity market in the World. Presently Zhongguo is on #9 spot. Liquidity? I got your liquidity right here...
Big Boys are all over it. More here: http://www.ftse.com/Research_and_Publications/2013Downloads/FTSE_China_A-shares_and_Global_Indices_Final_Version.pdf
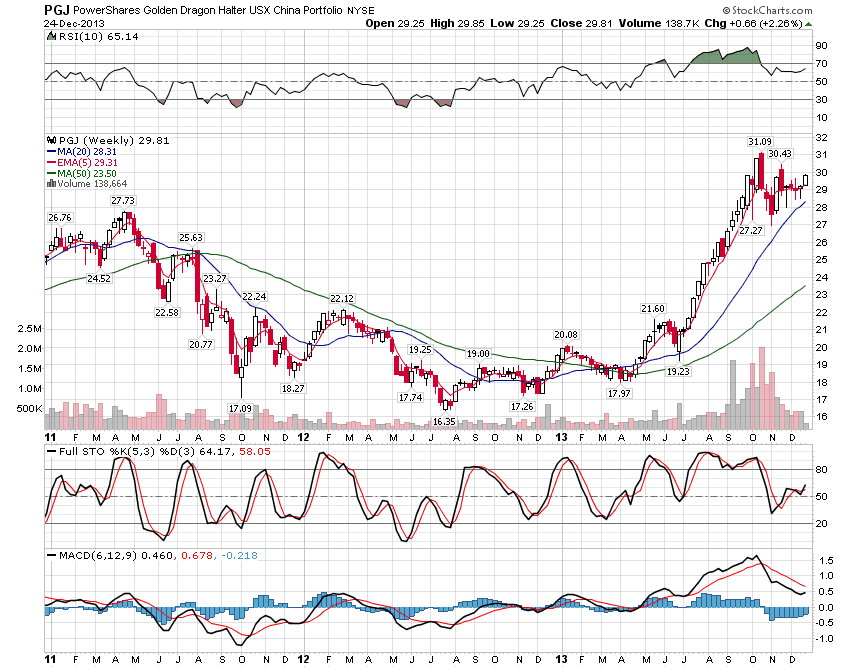
Bunch of new ETF's popping up all over the place, all ready with enormous expense ratios, vague allocation rules, and not enough money to go around. I am still most interested in FXI (large cap A-shares in Hong Kong), and PGJ (US listed), with possibly HAO (small caps)
PGJ - PowerShares Golden Dragon China Portfolio invests in N-Shares, Chinese companies listed in US. http://www.invescopowershares.com/products/overview.aspx?ticker=PGJ#hold
Expense ratio 0.75%. Severely overweight in Information Technology (55%). Abnormally largest holding (8.5%) is CTRP - Ctrip.com - some kind of travel and lodging service I never heard of.
Finviz screen: China, over 300mil market cap, over $5, over 100K average volume. 49 results.
Most of top ones are in PGJ, but at different weightings.
FXI - iShares FTSE China Large-Cap ETF, based on FTSE China 25 index, consisted mainly of H-Shares - blue chip stocks of largest 25 Chinese companies (H Shares, Red Chips and P Chips) listed on the Stock Exchange of Hong Kong. This seems to be the best access to A-Shares, as we have only few US traded, Hong Kong listed, Chinese main land companies to invest. (CHL, CEO, CHU, MPEL?)
...Easy as ChinaKing menu...
September 2014 they will change it to FTSE China 50 index, doubling allocation to A-Shares. http://www.ftse.com/Indices/FTSE_China_Index_Series/index.jspFXI has 0.75% exp ratio, 2% divi. Abnormally large allocation is Financials 56%.http://us.ishares.com/product_info/fund/overview/FXI.htm
UPDATE 11/26/2014
$SSEC started to rally at the end of summer 2014, and by November took out 2400-2500 resistance that started way back in winter of 2011. FXI is lagging somewhat, still fighting 40-42 level, but development is positive no doubt.
Investment landscape is poisoned by alot of scams and hype surrounding all kinds of internet, software and game stocks, plus BABA (ipo'd in September '14) pulled a lot of funds from everything China. Technically, stocks split into two distinct groups (for reasons unknown to me) - some gap and jump all over the place, others trade tight with good daily patterns. I focus on latter kind. Specifically I want to avoid anything with wide following, many news and busy Yahoo message board.
Of note:
all make money, except NORD
all don't have a lot of debt, except XRS and NORD
all don't have a lot of shorts, except ZPIN and MR (MR 16% float short; 23SR !)
all don't have high P/E, except JOBS (P/E 60!)
This list is not perfect by any stretch of imagination, but offers some alternatives off the beaten path, and should compliment FXI very nicely in 2015 and hopefully beyond. http://www.finviz.com/screener.ashx?v=150&t=HTHT,HMIN,MR,WX,CBPO,EDU,XRS,DL,NORD,JOBS,ZPIN,HOLI&o=-marketcap
“Free Lunch” is purely a short-term strategy... Traders and investors tend to get rid of their losers near yearend for
tax loss purposes, often driving these stocks down to bargain levels.
Research has shown that NYSE stocks trading at a new 52-week low on or
about December 15 will usually outperform the market by February 15 in
the following year.
I used similar filters in Finviz:
50mln+ market cap; 50K+ average volume; over $1 price
(they using 20mil market cap and 10K volume... c'mon, its a little bit out there, IMNSHO)
0-3% above 50day low; 50%+ below 52week high
The closer to 52week low, the better
Results as of 12/23/2013 BMO, shows alot of gold miners (no surprise here)
UPDATE 12/24/2013
On a second thought here are my picks. High short interest may be squeezed, low inst ownership may be increased, etc ... all weak reasons. I rather buy strong stocks on a rise, but willing give it a shot with half-position size an about half of these: http://stockcharts.com/freecharts/candleglance.html?IOC,TRX,MUX,PSMI,KGC,AU,BVN,IAG,CDE,KONG,AMCN,HMY|B|B10
Conservatively I should take 10% profit as soon as I have it, and not wait for mid February exit time-window. Entry low is the stop. No exceptions. Lets see...
UPDATE 1/16/2014
Now their list is revealed, and surprisingly it doesn't match mine very much. WTF? http://blog.stocktradersalmanac.com/post/Free-Lunch-Stocks-The-Gift-That-Keeps-on-Giving-NYA-COMPQ-SEED
18 stocks they selected show an average profit of 15%, with couple of small losers and several big winners.
I traded:
Now all out with small profit to show for my efforts, but I felt very uncomfortable, as this strategy goes against my philosophy of buying high and selling higher (also sell low and cover lower).
----------------------------------------------
From time to time we like to dissect the Dow Industrials. We look at
each component and classify it as being in a clear uptrend or a
sideways/neutral trend or a downtrend. Starting at 3M and going stock by
stock to Wal-Mart Stores we found that we could only count 10 Dow stocks in clear uptrends
even as the Dow made a new all-time high Wednesday. The 20 other stocks
have been a drag on the famous average. This same exercise back in
October 2007 found only 8 stocks making new highs while the remaining 22
were in bad shape (just think about the names that were subsequently
removed)....We suggest keeping a closer watch on those ten uptrends – MMM, AXP, BA,
DIS, DD, XOM, GE, GS, NKE, and V – and if they weaken without rotation
into the other names then a more defensive posture should be assumed.
Staying 50-70% invested. All long, bonds short (via TBT), with shorter and shorter holding periods. The bias is to reduce, protect gains, cut losses absolutely ASAP (if stock doesn't go in a market like this - it doesn't go at all).
I've been working inside this list, essentially for months, with only few changes.
I've been watching Copper prices since summer, noticing how stubbornly strong it was. Although not a Precious Metal, it sits between Platinum and Palladium on Finviz Futures page. Right next to Gold and Silver. A lonely speck of green in the ocean of red. Strong? Lets say: Not as weak...with strong support near $3.
I think my position is well known:
This economy has been shit since 2011, and got worse since 2012.
I wrote about it here just recently (link) and also back in May (link) , all against the backdrop of Roaring Bull Market (link). (How is it possible? Dow Paradox, bro...you feel me?)
Seems to me that Dr Copper, PhD in Economics, kinda agrees with bitter yellow fruit here about the state of real economy.
There are only 4 copper miners in Finviz. FCX is the biggest, with highest dividend and smallest short ratio, but also with most debt.
Following System 12 rules, only $copper, JJC, FCX, RIO, LIWA qualifies for position. COPX is 10% under 200sma! Volume Profile is horrid on all. Nobody buys copper miners.
---------------------------------------------------------------------------
Here is Jeff Hirsch of Stock Trader Almanac on strong seasonality of Copper from mid-December to end of February. http://blog.stocktradersalmanac.com/post/Coppers-Historically-Strong-Season-Begins-Soon-HGF-SCCO
Since 2001 there was only 2 loosing years 2006 and 2012.
I notice, that although 2012 officially failed, there was a material rally from beginning of November 2012 to beginning of February 2013. Important not to overstay my welcome.
There is an etf from GlobalX http://www.globalxfunds.com/COPX with 0.65% exp ratio, and 5% divi.
COPX has less then 30 holdings, with FCX, SCCO and Glencore at about 5% each. Top 2 holdings are Canadian companies III.TO and CS.TO.
. NOTE: as of 7/1/2015 this compound will not be updated any more.....
. head over to new Theme Compound of 2015 (link) ....
................................................................................................................
I will attempt to organize various themes that are of interest to me in this Theme Compound of 2013.
The notion of Theme Investing has been paying off for years. So much so, I decided to make it my main approach to investing. "Cut your losses short and let your winners run" is a great principle of most winning traders. It doesn't have to be applied only to positions... I can use it for strategy selection.
I wrote about System 9 and Theme Investing in this post (link). Its a start...
TECHNIQUES
OF TAPE READING- by VADYM GRAIFER & CHRISTOPHER SCHUMACHER
PART ONE
A Trader’s Journey
TRADING MANTRAS
As I continued trading, I managed to make those periods of blackouts shorter
and shorter. I accepted that they would happen, without frustration or panic.
When they occurred, I cut back on my activity and tried
to minimize my losses while waiting for my clear state of mind to return. Step
by step I developed some new ideas for returning to the correct mindset more
quickly. I wrote several mantras that I would read and repeat, in a sense
meditating on the subject. After a while I wrote mantras for specific trading
problems. Regular repetition of them helped me reduce the number of those
undesirable periods and make the ones I did experience much shorter. I regained
control over myself once again. The mantras follow.
Things don't fit together any more. Never mind the usual wall-of-worry, markets have gone haywire and its getting worse.
Stocks are at all time highs, volume and participation are very low, there is no public interest (nobody wants to talk to me about stocks).
Gold, Silver and miners are on a death spiral down. That great rally I picked from July to September is all gone. Since then (and especially in November) every bullish signal, every attempt to rally was blown. Its like stocks, only in reverse. I talked some people into buying coins...they don't talk to me anymore
Gov Bonds are in bear market, that nobody trades, nobody recognizes. I've been telling people to get out of bonds for a couple of years now. Nobody did. Meanwhile rates doubled!
Commodities are in a toilet. All of them (except may-be Cocoa and Rice).
Without a doubt, all this represents an opportunity of lifetime. Literally. Especially commodities.Corn and Copper are not going to zero, not going to bankruptcy, and not going to reverse split either. Oil stands kinda separately , I think people use it as a 'store of money', a last inflation hedge that's working. It's a mistake - a foolish mis-allocation that lasted long enough to become 'a norm'. Oil worth less than 100 (may be alot less), just as surely as Coffee worth more than 100 (may be alot more). Commodity stocks is a different story (I'm working on it).
This is kind of data I like. Un-massaged. No ratios to GDP, or unemployment, or inflation, or any kind of statistical ratios. GDP is the worst. First of all they restated it going back years (happened couple of years ago). Then it depends, how you calculate GDP. Here is ShadowStats alternative plot. Big difference, its been negative for years. Incidentally, this view corresponds very well to my own business in America since 1991. That drop during 2000-2002 recession, and then recovery somewhat into 2004-2006, exactly as I experienced myself. http://www.shadowstats.com/alternate_data/gross-domestic-product-charts
My business blow-up at the lows, there was almost no recovery - that industry is still just a remnant of its former self.
-----------------------------------------------------------------------
Price of retail ground beef 1980-2013. Presented below with no comments. Really
All the hoopla about gov. economic statistic is bad enough. Consider alternatives, remember revisions, adjust forecasts...doesn't help. Now even more confusing, but also with mind-boggling numbers. Billions, Trillions. Like its nothing, not even paper - just digits on a screen.
Instagram sold to Facebook for 1 Billion Dollars. 5 people in a room, $100K revenues, no profit.
SnapChat turned down offer for 2 Billion. 2 people in a bungalo. No revenues.
Twiter is a 22Bil market cap company; FaceBook 117Bil
"Hey, Boichik. How much money do you want to make?"
" A Billion, pa"
15 year old kid. Left me speechless.
I see all this as a steaming pile of HORSESHIT!
Every number they spin around is either a guess, or wish, or lie.
Think
about it - You can buy entire Long Bond market for about 1.5bil in
margin account. I mean ALL of 30-yr bond open interest! This number is
the ONLY real number I need to know.
Everything else - just somebody's
agenda.
------------------------------------------------------------------------
Charles Biderman of TrimTabs: GDP & BLS Job Numbers Are Worthless Garbage!


